EX-99.2
Published on November 8, 2023
|
THIRD QUARTER 2023 |

|
2 FORWARD-LOOKING STATEMENTS Except for historical information, certain matters discussed in this presentation may be forward-looking statements within the meaning of the Private Securities Litigation Reform Act of 1995. Forward-looking statements include but are not limited to all projections and anticipated levels of future performance. Forward-looking statements involve risks, uncertainties and other factors that may cause our actual results to differ materially from those discussed herein. Any number of factors could cause actual results to differ materially from projections or forward-looking statements, including without limitation, changes to global economic, social and political conditions, spending patterns of government agencies, competitive pressures, the impact of acquisitions and related integration activities, logistical challenges related to disruptions and delays, product liability claims, the success of new product introductions, currency exchange rate fluctuations and the risks of doing business in the markets in which we operate, including foreign countries. More information on potential factors that could affect the Company’s financial results are more fully described from time to time in the Company’s public reports filed with the Securities and Exchange Commission, including the Company’s Annual Report on Form 10-K, Quarterly Reports on Form 10-Q, and Current Reports on Form 8-K. All forward-looking statements included in this presentation are based upon information available to the Company as of the date of this presentation, and speak only as of the date hereof. We assume no obligation to update any forward-looking statements to reflect events or circumstances after the date of this presentation. 2 |
|
TODAY’S PRESENTERS 3 BRAD WILLIAMS President BLAINE BROWERS Chief Financial Officer WARREN KANDERS Chief Executive Officer and Chairman of the Board |

|
4 AGENDA • Q3 Highlights • Business Overview • Financial Summary • Full Year Outlook • Conclusion and Q&A |
|
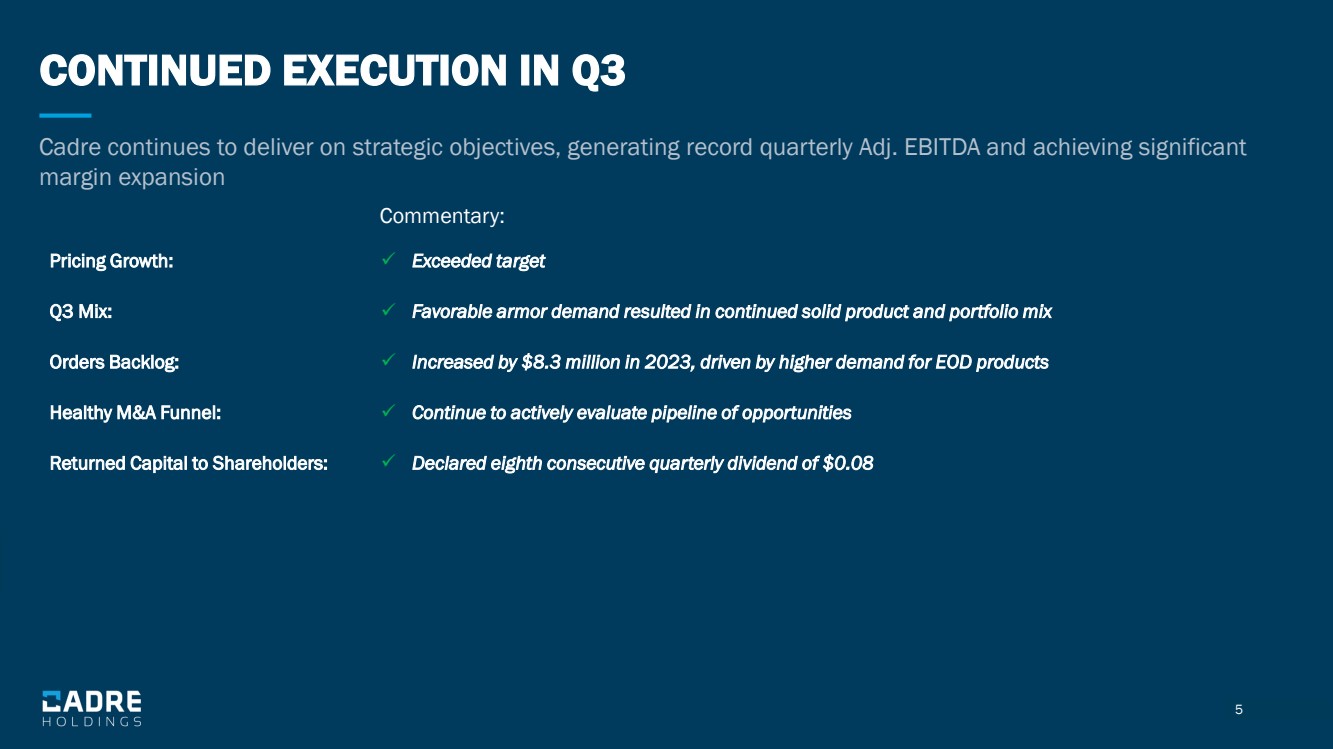
5 CONTINUED EXECUTION IN Q3 Cadre continues to deliver on strategic objectives, generating record quarterly Adj. EBITDA and achieving significant margin expansion Pricing Growth: ✓ Exceeded target Q3 Mix: ✓ Favorable armor demand resulted in continued solid product and portfolio mix Orders Backlog: ✓ Increased by $8.3 million in 2023, driven by higher demand for EOD products Healthy M&A Funnel: ✓ Continue to actively evaluate pipeline of opportunities Returned Capital to Shareholders: ✓ Declared eighth consecutive quarterly dividend of $0.08 Commentary: |
|
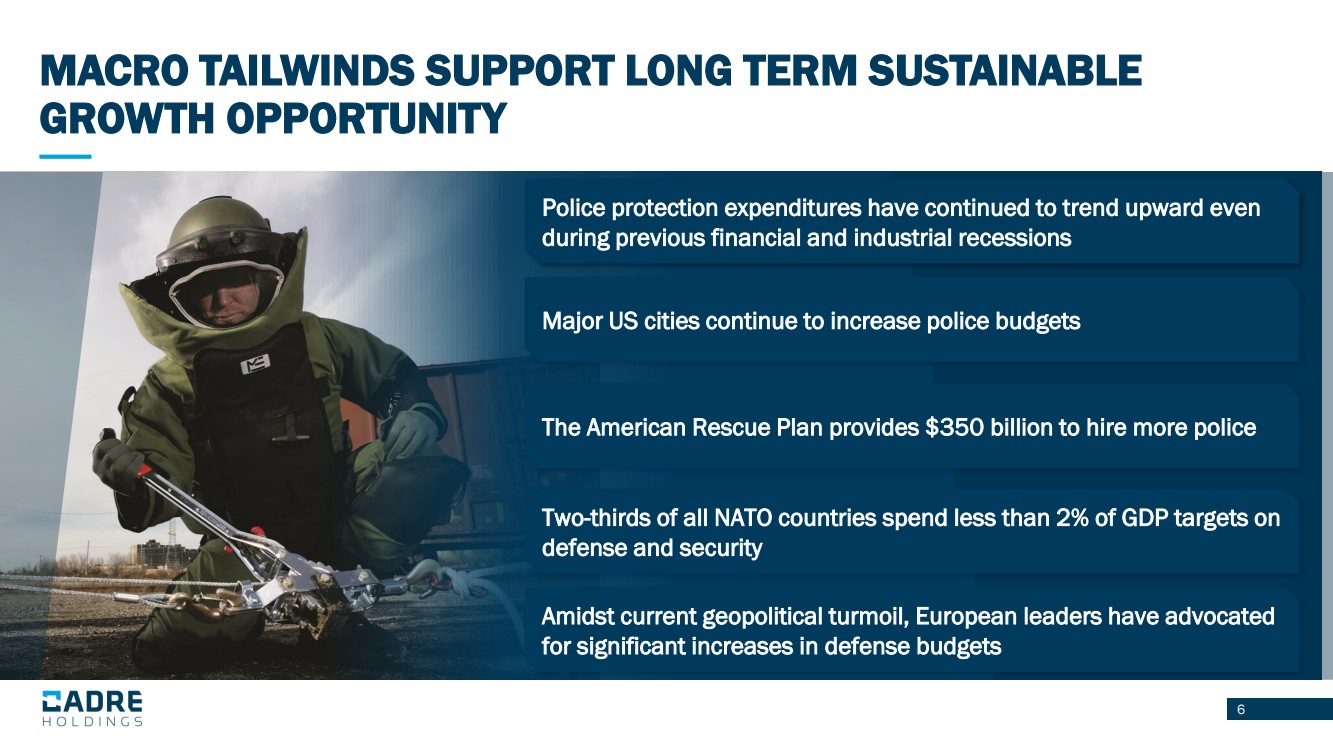
6 MACRO TAILWINDS SUPPORT LONG TERM SUSTAINABLE GROWTH OPPORTUNITY Two-thirds of all NATO countries spend less than 2% of GDP targets on defense and security Amidst current geopolitical turmoil, European leaders have advocated for significant increases in defense budgets Police protection expenditures have continued to trend upward even during previous financial and industrial recessions Major US cities continue to increase police budgets The American Rescue Plan provides $350 billion to hire more police |
|
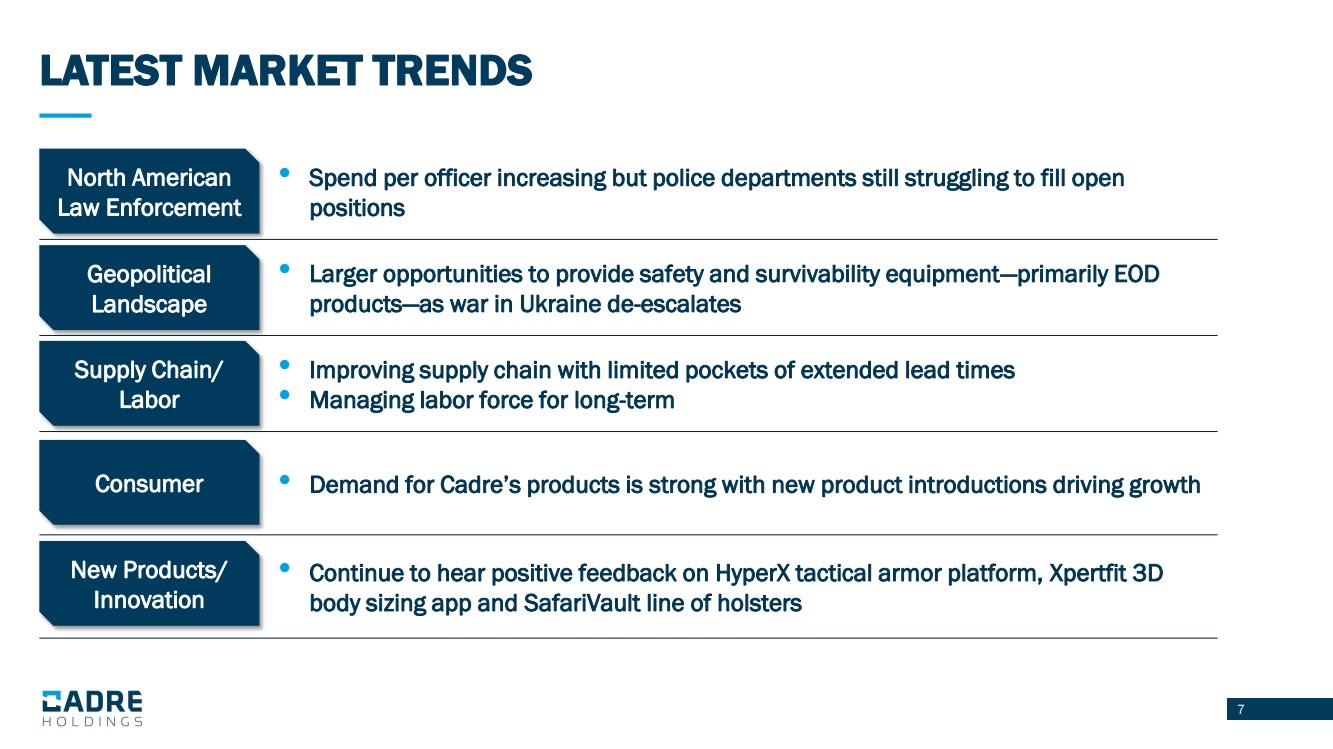
7 • Spend per officer increasing but police departments still struggling to fill open positions • Larger opportunities to provide safety and survivability equipment—primarily EOD products—as war in Ukraine de-escalates • Improving supply chain with limited pockets of extended lead times • Managing labor force for long-term • Demand for Cadre’s products is strong with new product introductions driving growth • Continue to hear positive feedback on HyperX tactical armor platform, Xpertfit 3D body sizing app and SafariVault line of holsters North American Law Enforcement Geopolitical Landscape Supply Chain/ Labor Consumer LATEST MARKET TRENDS New Products/ Innovation |
|
81320 CADRE'S KEY M&ACRITERIA Niche market No large-cap competition Leading market position Cost structurewherematerial> labor Leading and defensible technology High cost of substitution Mission-critical tocustomer Recurring revenueprofile Asset-light Business Financial Market Strong brandrecognition Attractive ROIC Resiliency through market cycles CADRE'S KEY M&A CRITERIA 8 |

|
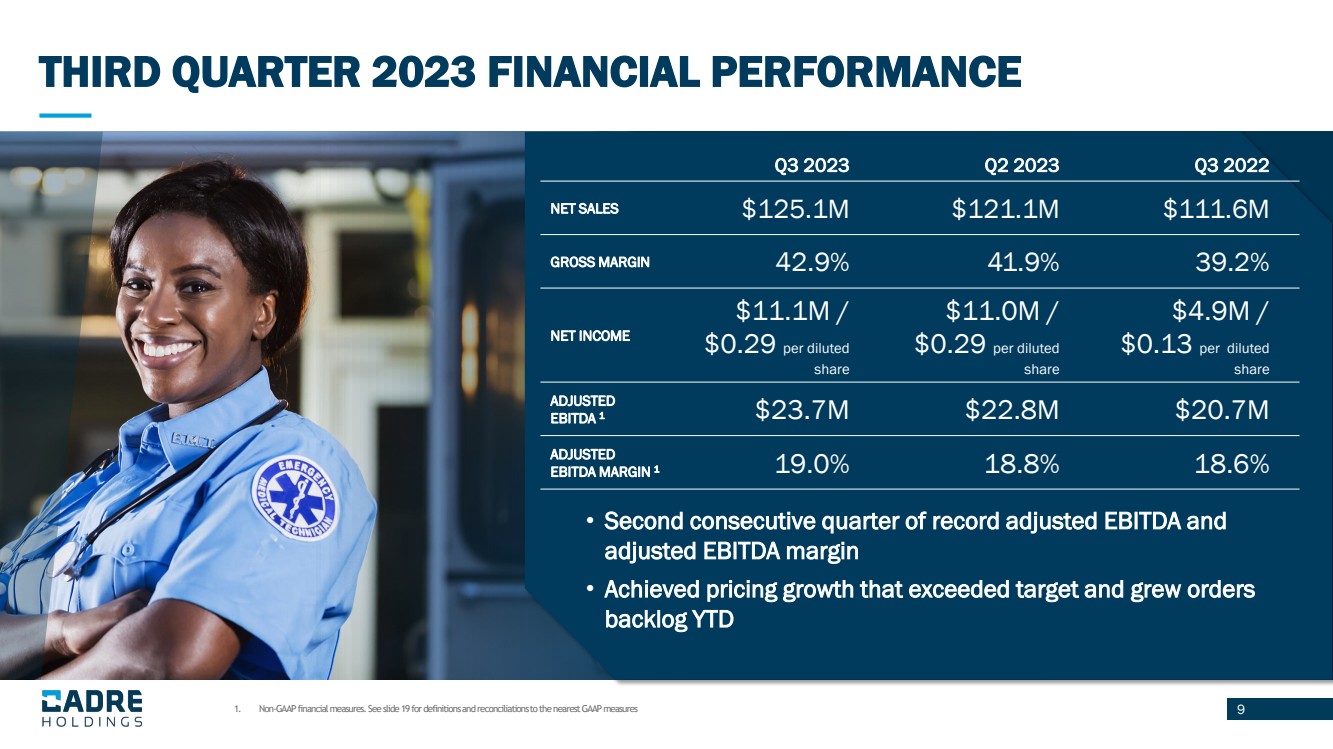
9 THIRD QUARTER 2023 FINANCIAL PERFORMANCE 1. Non-GAAP financial measures. See slide 19 for definitions and reconciliations to the nearest GAAP measures • Second consecutive quarter of record adjusted EBITDA and adjusted EBITDA margin • Achieved pricing growth that exceeded target and grew orders backlog YTD Q3 2023 Q2 2023 Q3 2022 NET SALES $125.1M $121.1M $111.6M GROSS MARGIN 42.9% 41.9% 39.2% NET INCOME $11.1M / $0.29 per diluted share $11.0M / $0.29 per diluted share $4.9M / $0.13 per diluted share ADJUSTED EBITDA 1 $23.7M $22.8M $20.7M ADJUSTED EBITDA MARGIN 1 19.0% 18.8% 18.6% |
|
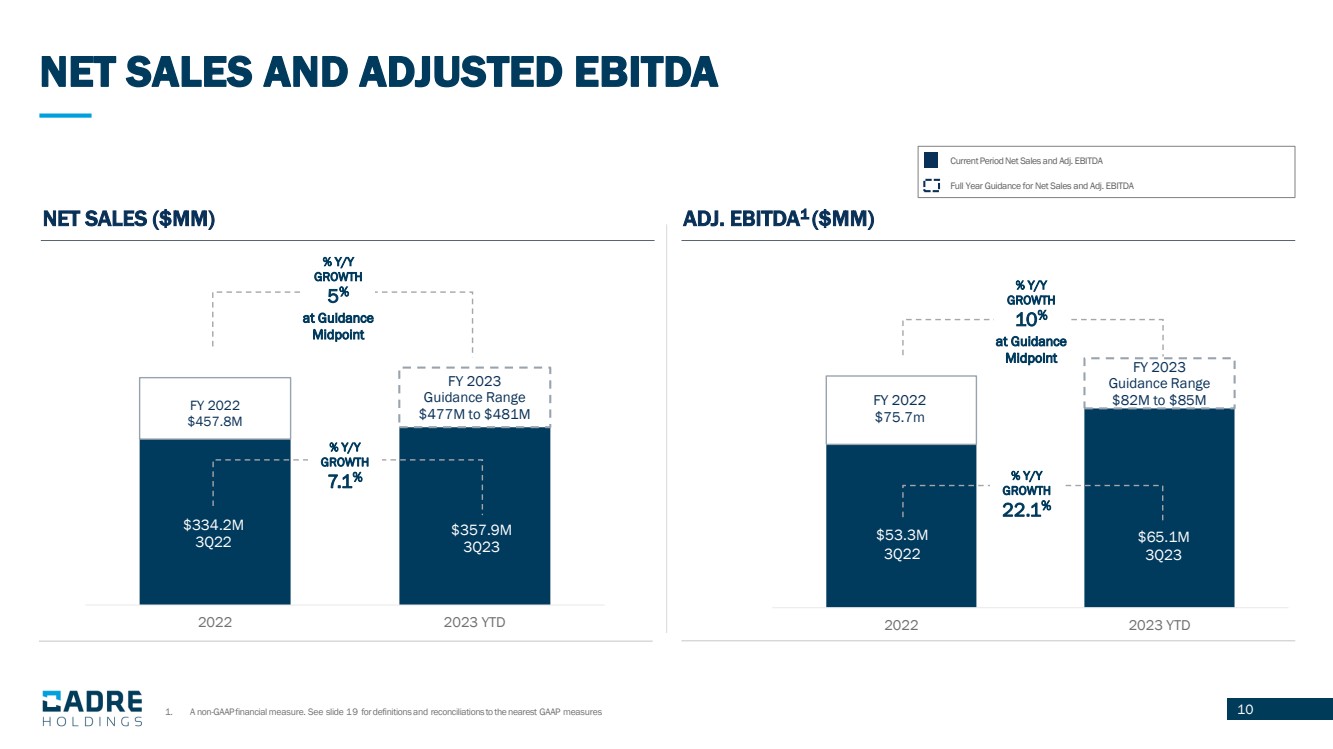
10 Current Period Net Sales and Adj. EBITDA Full Year Guidance for Net Sales and Adj. EBITDA NET SALES AND ADJUSTED EBITDA NET SALES ($MM) $334.2M 3Q22 $357.9M 3Q23 FY 2022 $457.8M FY 2023 Guidance Range $477M to $481M 2022 2023 YTD % Y/Y GROWTH 7.1% % Y/Y GROWTH 5 % at Guidance Midpoint ADJ. EBITDA1 ($MM) FY 2022 $75.7m $65.1M 3Q23 FY 2023 Guidance Range $82M to $85M 2022 2023 YTD % Y/Y GROWTH 22.1% 1. A non-GAAP financial measure. See slide 19 for definitions and reconciliations to the nearest GAAP measures $53.3M 3Q22 % Y/Y GROWTH 10% at Guidance Midpoint |
|
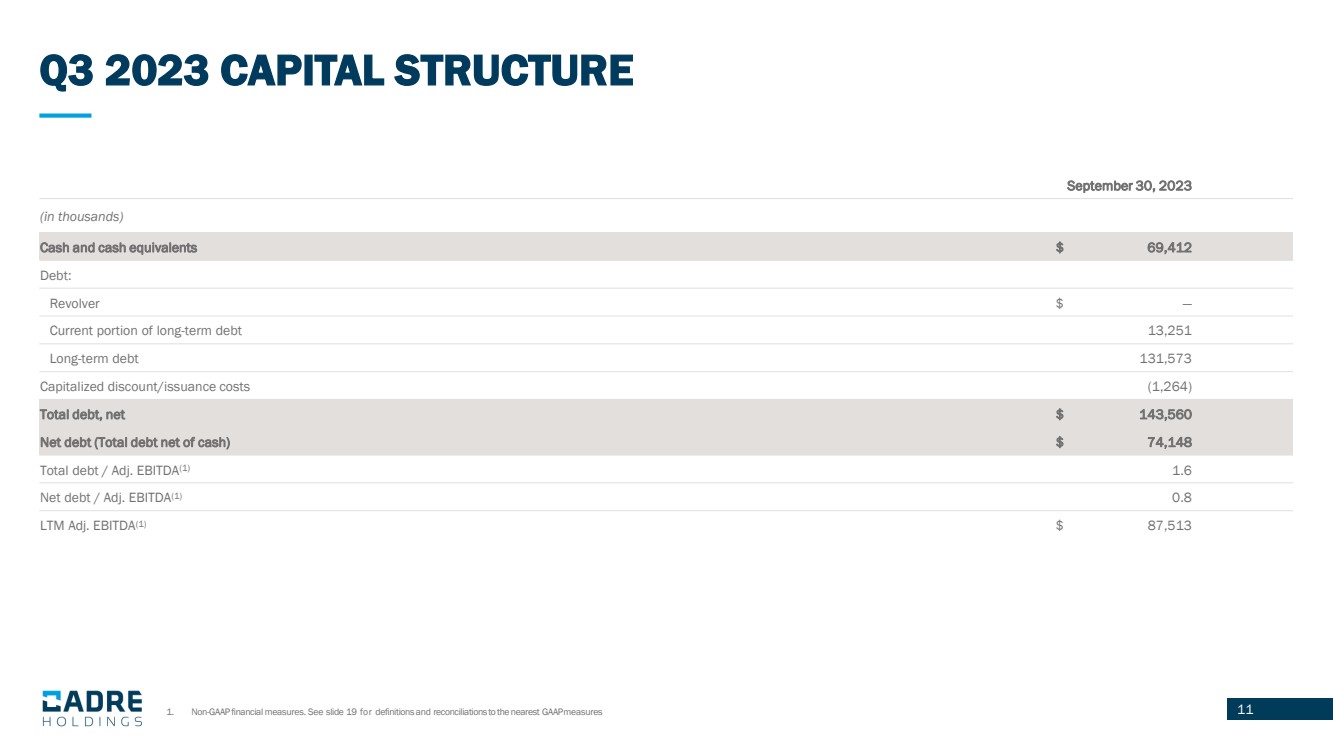
11 Q3 2023 CAPITAL STRUCTURE 1. Non-GAAP financial measures. See slide 19 for definitions and reconciliations to the nearest GAAPmeasures September 30, 2023 (in thousands) Cash and cash equivalents $ 69,412 Debt: Revolver $ — Current portion of long-term debt 13,251 Long-term debt 131,573 Capitalized discount/issuance costs (1,264) Total debt, net $ 143,560 Net debt (Total debt net of cash) $ 74,148 Total debt / Adj. EBITDA(1) 1.6 Net debt / Adj. EBITDA(1) 0.8 LTM Adj. EBITDA(1) $ 87,513 |
|
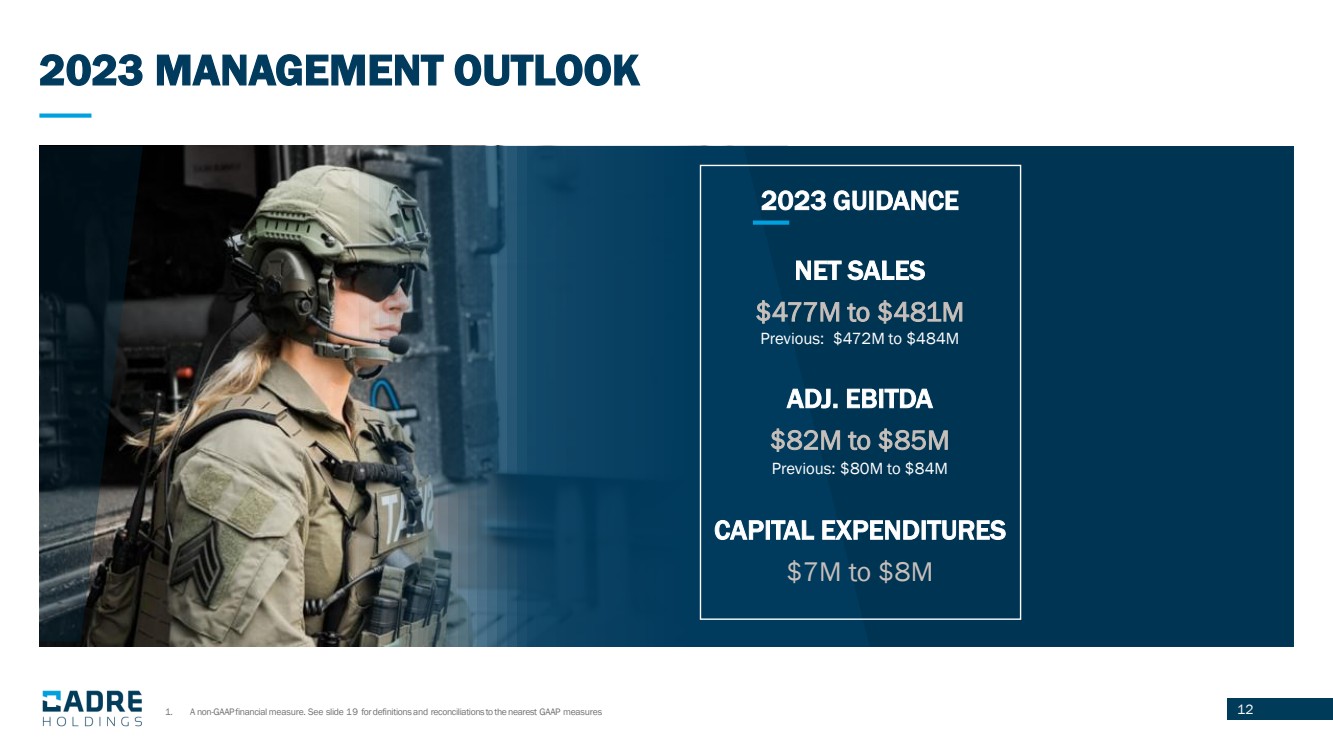
12 2023 MANAGEMENT OUTLOOK 2023 GUIDANCE NET SALES $477M to $481M Previous: $472M to $484M ADJ. EBITDA $82M to $85M Previous: $80M to $84M CAPITAL EXPENDITURES $7M to $8M 1. A non-GAAP financial measure. See slide 19 for definitions and reconciliations to the nearest GAAP measures |
|
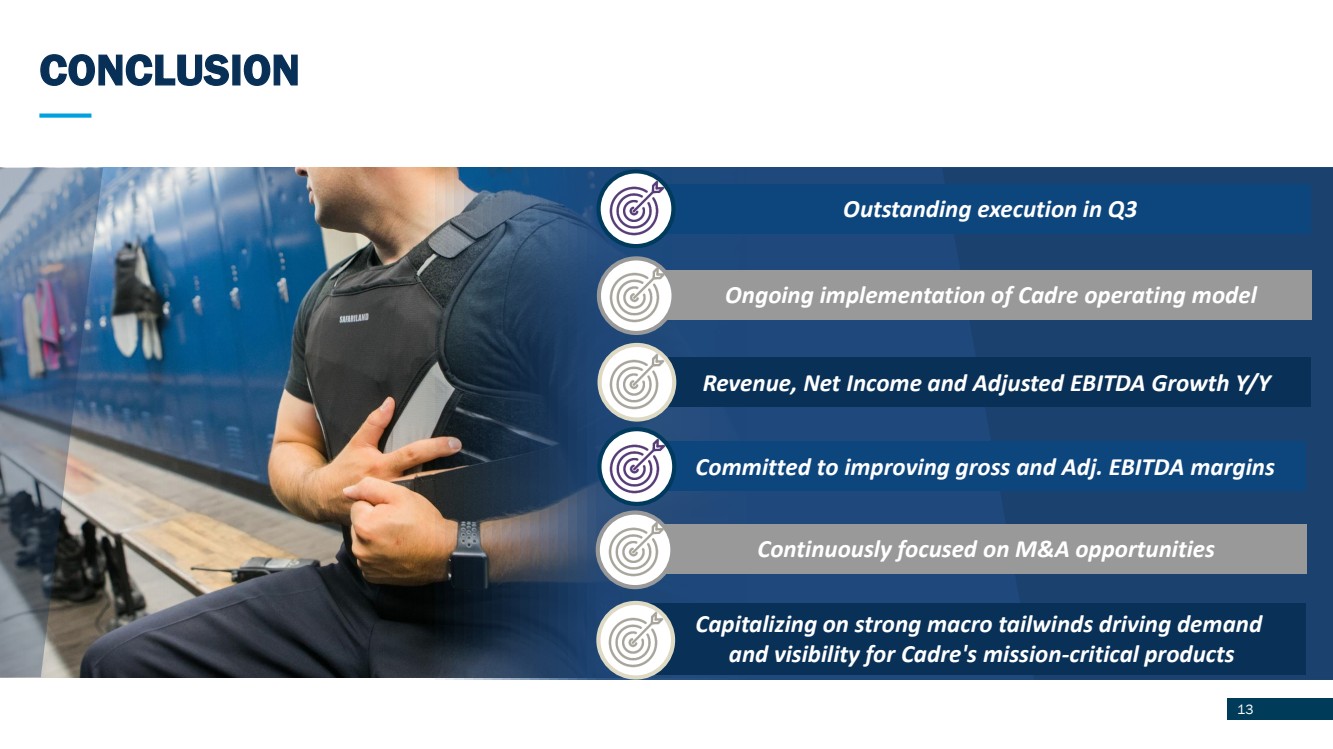
CONCLUSION 13 Outstanding execution in Q3 Revenue, Net Income and Adjusted EBITDA Growth Y/Y Ongoing implementation of Cadre operating model Committed to improving gross and Adj. EBITDA margins Capitalizing on strong macro tailwinds driving demand and visibility for Cadre's mission-critical products Continuously focused on M&A opportunities |
|
14 APPENDIX |

|
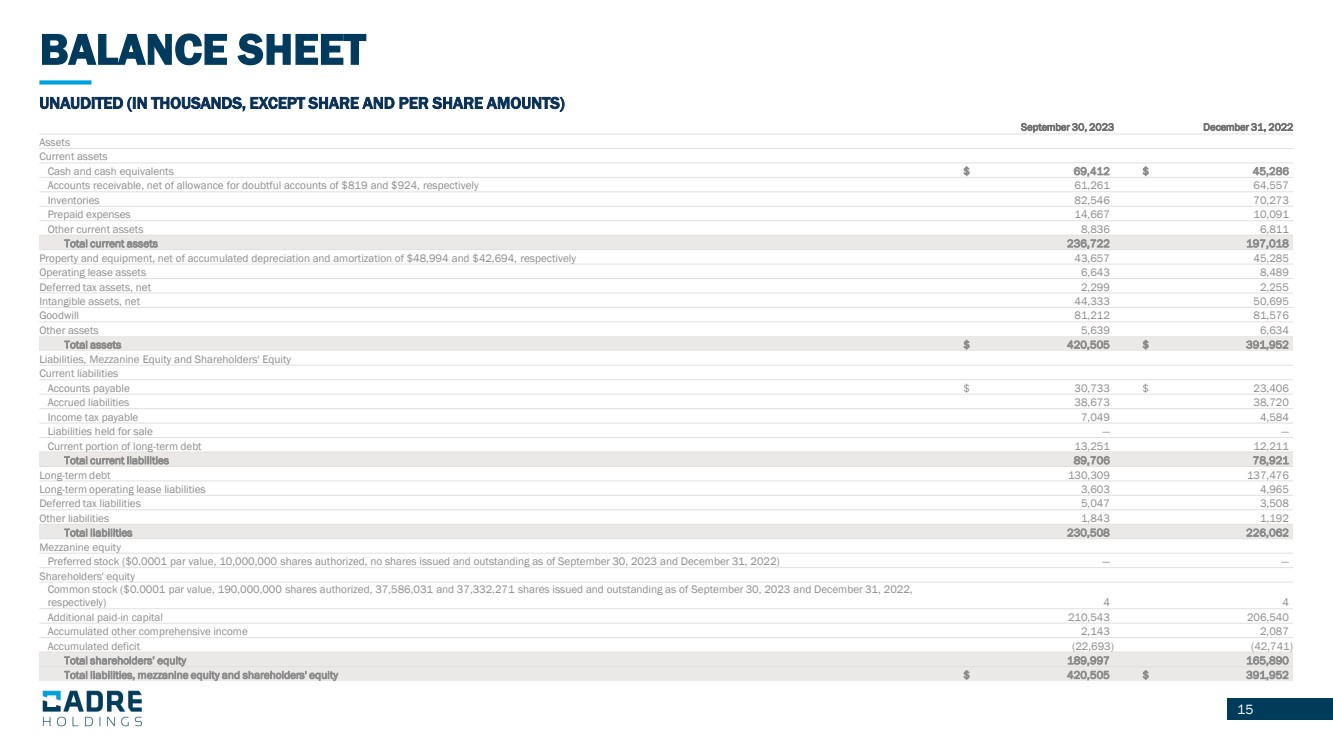
15 BALANCE SHEET UNAUDITED (IN THOUSANDS, EXCEPT SHARE AND PER SHARE AMOUNTS) September 30, 2023 December 31, 2022 Assets Current assets Cash and cash equivalents $ 69,412 $ 45,286 Accounts receivable, net of allowance for doubtful accounts of $819 and $924, respectively 61,261 64,557 Inventories 82,546 70,273 Prepaid expenses 14,667 10,091 Other current assets 8,836 6,811 Total current assets 236,722 197,018 Property and equipment, net of accumulated depreciation and amortization of $48,994 and $42,694, respectively 43,657 45,285 Operating lease assets 6,643 8,489 Deferred tax assets, net 2,299 2,255 Intangible assets, net 44,333 50,695 Goodwill 81,212 81,576 Other assets 5,639 6,634 Total assets $ 420,505 $ 391,952 Liabilities, Mezzanine Equity and Shareholders' Equity Current liabilities Accounts payable $ 30,733 $ 23,406 Accrued liabilities 38,673 38,720 Income tax payable 7,049 4,584 Liabilities held for sale — — Current portion of long-term debt 13,251 12,211 Total current liabilities 89,706 78,921 Long-term debt 130,309 137,476 Long-term operating lease liabilities 3,603 4,965 Deferred tax liabilities 5,047 3,508 Other liabilities 1,843 1,192 Total liabilities 230,508 226,062 Mezzanine equity Preferred stock ($0.0001 par value, 10,000,000 shares authorized, no shares issued and outstanding as of September 30, 2023 and December 31, 2022) — — Shareholders' equity Common stock ($0.0001 par value, 190,000,000 shares authorized, 37,586,031 and 37,332,271 shares issued and outstanding as of September 30, 2023 and December 31, 2022, respectively) 4 4 Additional paid-in capital 210,543 206,540 Accumulated other comprehensive income 2,143 2,087 Accumulated deficit (22,693) (42,741) Total shareholders’ equity 189,997 165,890 Total liabilities, mezzanine equity and shareholders' equity $ 420,505 $ 391,952 |
|
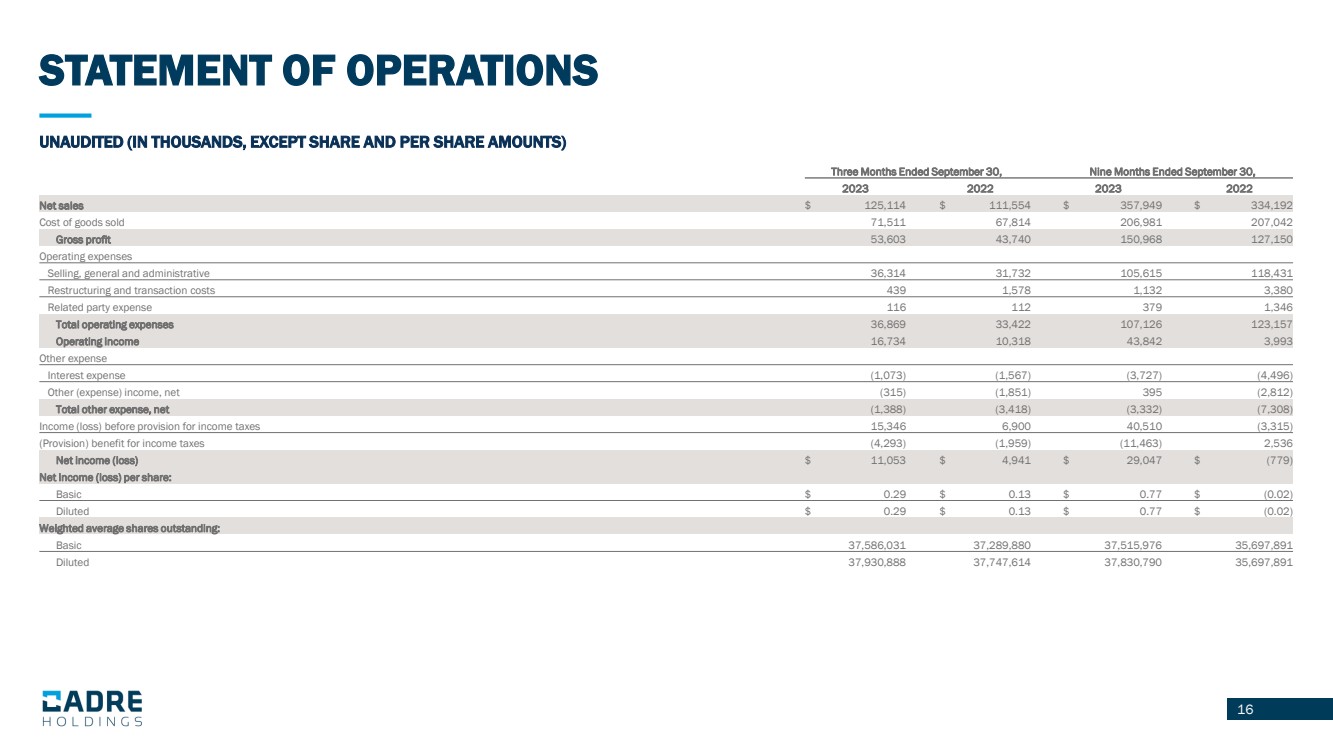
16 STATEMENT OF OPERATIONS UNAUDITED (IN THOUSANDS, EXCEPT SHARE AND PER SHARE AMOUNTS) Three Months Ended September 30, Nine Months Ended September 30, 2023 2022 2023 2022 Net sales $ 125,114 $ 111,554 $ 357,949 $ 334,192 Cost of goods sold 71,511 67,814 206,981 207,042 Gross profit 53,603 43,740 150,968 127,150 Operating expenses Selling, general and administrative 36,314 31,732 105,615 118,431 Restructuring and transaction costs 439 1,578 1,132 3,380 Related party expense 116 112 379 1,346 Total operating expenses 36,869 33,422 107,126 123,157 Operating income 16,734 10,318 43,842 3,993 Other expense Interest expense (1,073) (1,567) (3,727) (4,496) Other (expense) income, net (315) (1,851) 395 (2,812) Total other expense, net (1,388) (3,418) (3,332) (7,308) Income (loss) before provision for income taxes 15,346 6,900 40,510 (3,315) (Provision) benefit for income taxes (4,293) (1,959) (11,463) 2,536 Net income (loss) $ 11,053 $ 4,941 $ 29,047 $ (779) Net income (loss) per share: Basic $ 0.29 $ 0.13 $ 0.77 $ (0.02) Diluted $ 0.29 $ 0.13 $ 0.77 $ (0.02) Weighted average shares outstanding: Basic 37,586,031 37,289,880 37,515,976 35,697,891 Diluted 37,930,888 37,747,614 37,830,790 35,697,891 |
|
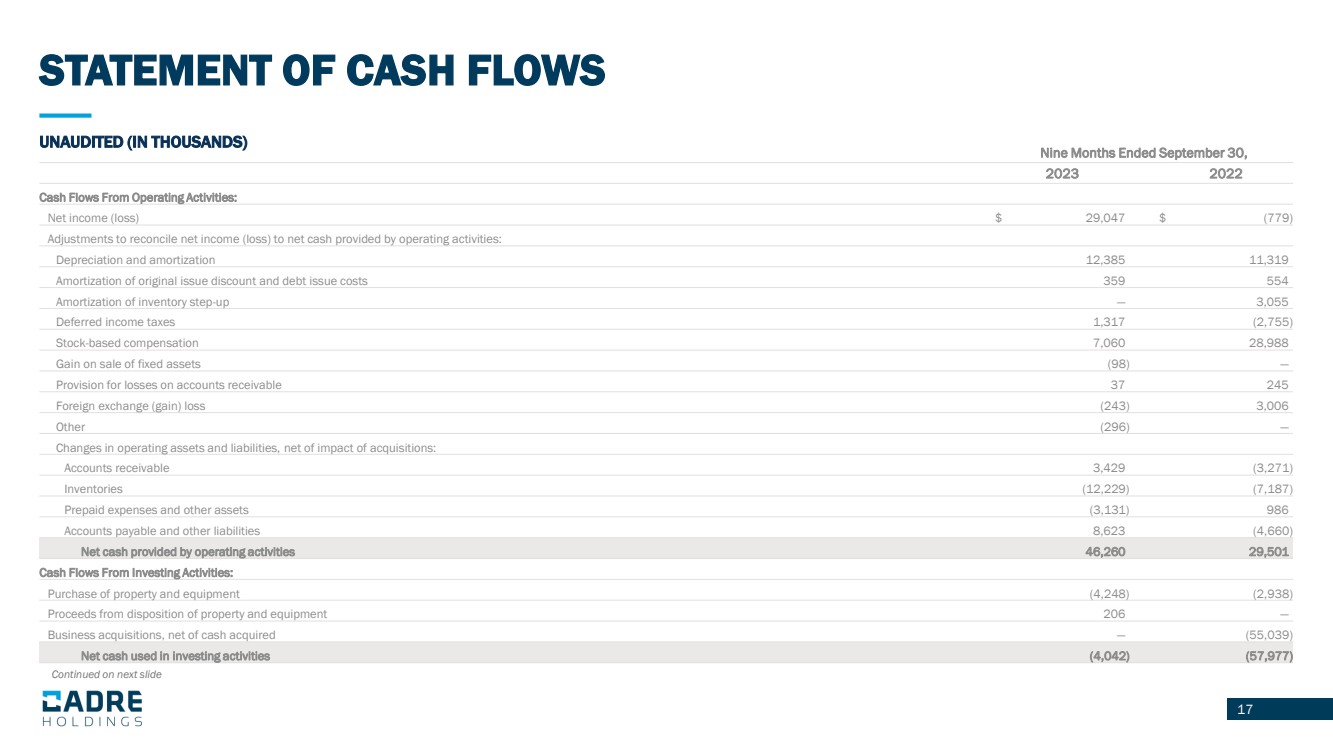
17 STATEMENT OF CASH FLOWS UNAUDITED (IN THOUSANDS) Nine Months Ended September 30, 2023 2022 Cash Flows From Operating Activities: Net income (loss) $ 29,047 $ (779) Adjustments to reconcile net income (loss) to net cash provided by operating activities: Depreciation and amortization 12,385 11,319 Amortization of original issue discount and debt issue costs 359 554 Amortization of inventory step-up — 3,055 Deferred income taxes 1,317 (2,755) Stock-based compensation 7,060 28,988 Gain on sale of fixed assets (98) — Provision for losses on accounts receivable 37 245 Foreign exchange (gain) loss (243) 3,006 Other (296) — Changes in operating assets and liabilities, net of impact of acquisitions: Accounts receivable 3,429 (3,271) Inventories (12,229) (7,187) Prepaid expenses and other assets (3,131) 986 Accounts payable and other liabilities 8,623 (4,660) Net cash provided by operating activities 46,260 29,501 Cash Flows From Investing Activities: Purchase of property and equipment (4,248) (2,938) Proceeds from disposition of property and equipment 206 — Business acquisitions, net of cash acquired — (55,039) Net cash used in investing activities (4,042) (57,977) Continued on next slide |
|
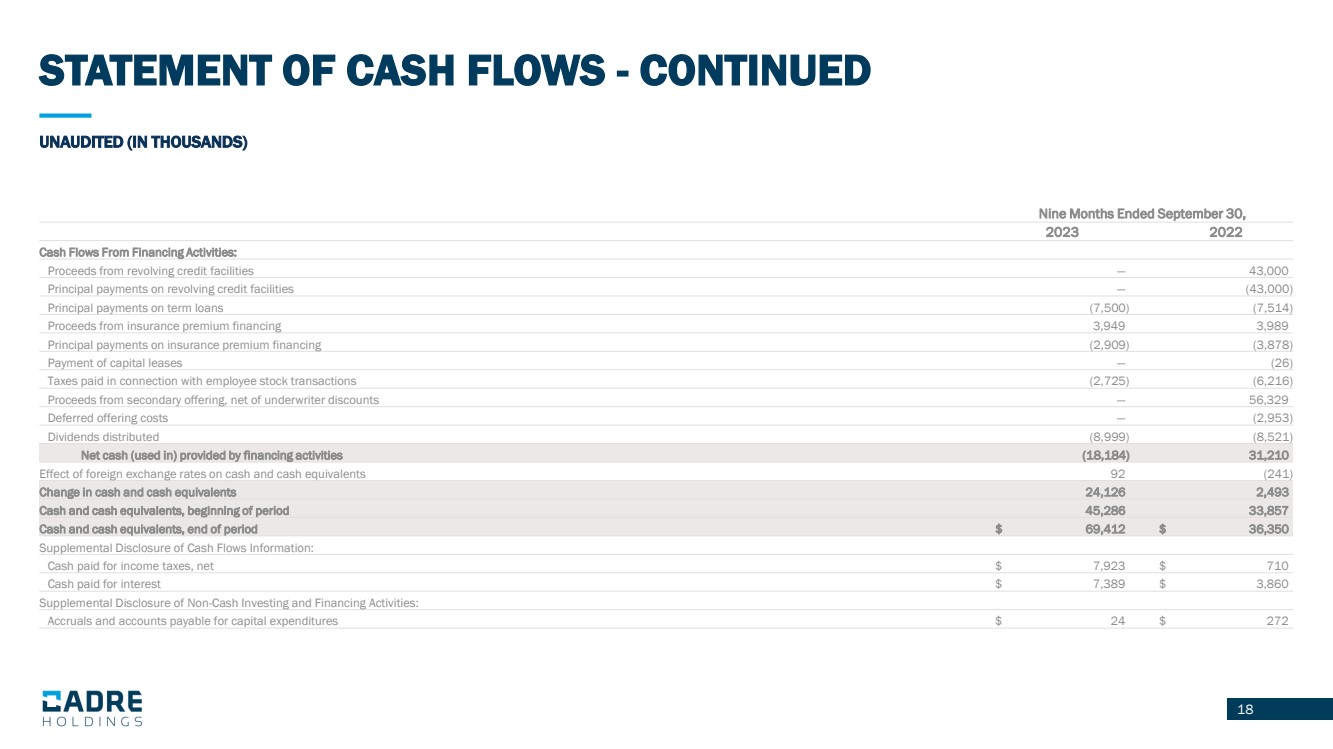
18 STATEMENT OF CASH FLOWS - CONTINUED UNAUDITED (IN THOUSANDS) Nine Months Ended September 30, 2023 2022 Cash Flows From Financing Activities: Proceeds from revolving credit facilities — 43,000 Principal payments on revolving credit facilities — (43,000) Principal payments on term loans (7,500) (7,514) Proceeds from insurance premium financing 3,949 3,989 Principal payments on insurance premium financing (2,909) (3,878) Payment of capital leases — (26) Taxes paid in connection with employee stock transactions (2,725) (6,216) Proceeds from secondary offering, net of underwriter discounts — 56,329 Deferred offering costs — (2,953) Dividends distributed (8,999) (8,521) Net cash (used in) provided by financing activities (18,184) 31,210 Effect of foreign exchange rates on cash and cash equivalents 92 (241) Change in cash and cash equivalents 24,126 2,493 Cash and cash equivalents, beginning of period 45,286 33,857 Cash and cash equivalents, end of period $ 69,412 $ 36,350 Supplemental Disclosure of Cash Flows Information: Cash paid for income taxes, net $ 7,923 $ 710 Cash paid for interest $ 7,389 $ 3,860 Supplemental Disclosure of Non-Cash Investing and Financing Activities: Accruals and accounts payable for capital expenditures $ 24 $ 272 |
|
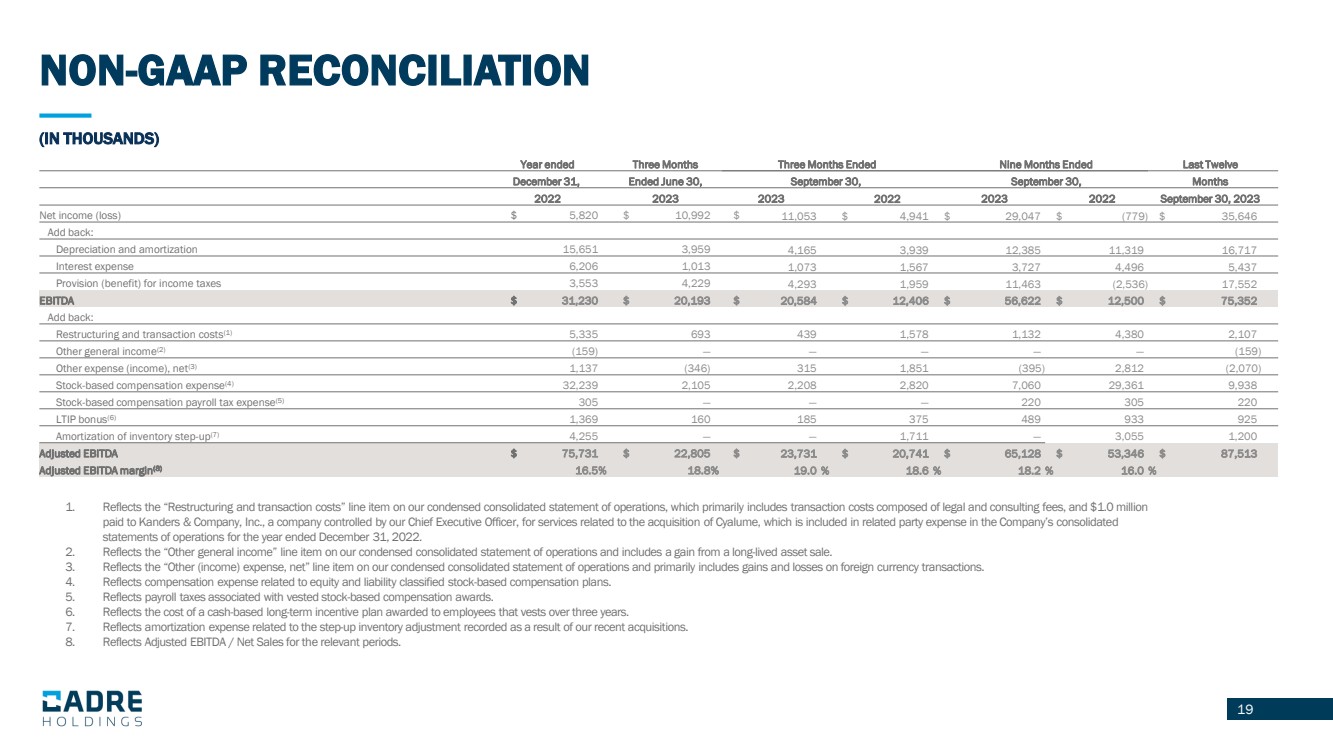
19 1. Reflects the “Restructuring and transaction costs” line item on our condensed consolidated statement of operations, which primarily includes transaction costs composed of legal and consulting fees, and $1.0 million paid to Kanders & Company, Inc., a company controlled by our Chief Executive Officer, for services related to the acquisition of Cyalume, which is included in related party expense in the Company’s consolidated statements of operations for the year ended December 31, 2022. 2. Reflects the “Other general income” line item on our condensed consolidated statement of operations and includes a gain from a long-lived asset sale. 3. Reflects the “Other (income) expense, net” line item on our condensed consolidated statement of operations and primarily includes gains and losses on foreign currency transactions. 4. Reflects compensation expense related to equity and liability classified stock-based compensation plans. 5. Reflects payroll taxes associated with vested stock-based compensation awards. 6. Reflects the cost of a cash-based long-term incentive plan awarded to employees that vests over three years. 7. Reflects amortization expense related to the step-up inventory adjustment recorded as a result of our recent acquisitions. 8. Reflects Adjusted EBITDA / Net Sales for the relevant periods. 19 (IN THOUSANDS) NON-GAAP RECONCILIATION Year ended Three Months Three Months Ended Nine Months Ended Last Twelve December 31, Ended June 30, September 30, September 30, Months 2022 2023 2023 2022 2023 2022 September 30, 2023 Net income (loss) $ 5,820 $ 10,992 $ 11,053 $ 4,941 $ 29,047 $ (779) $ 35,646 Add back: Depreciation and amortization 15,651 3,959 4,165 3,939 12,385 11,319 16,717 Interest expense 6,206 1,013 1,073 1,567 3,727 4,496 5,437 Provision (benefit) for income taxes 3,553 4,229 4,293 1,959 11,463 (2,536) 17,552 EBITDA $ 31,230 $ 20,193 $ 20,584 $ 12,406 $ 56,622 $ 12,500 $ 75,352 Add back: Restructuring and transaction costs(1) 5,335 693 439 1,578 1,132 4,380 2,107 Other general income(2) (159) — — — — — (159) Other expense (income), net(3) 1,137 (346) 315 1,851 (395) 2,812 (2,070) Stock-based compensation expense(4) 32,239 2,105 2,208 2,820 7,060 29,361 9,938 Stock-based compensation payroll tax expense(5) 305 — — — 220 305 220 LTIP bonus(6) 1,369 160 185 375 489 933 925 Amortization of inventory step-up(7) 4,255 — — 1,711 — 3,055 1,200 Adjusted EBITDA $ 75,731 $ 22,805 $ 23,731 $ 20,741 $ 65,128 $ 53,346 $ 87,513 Adjusted EBITDA margin(8) 16.5% 18.8% 19.0 % 18.6 % 18.2 % 16.0 % |