EX-99.2
Published on March 11, 2025
|
FOURTH QUARTER 2024 |

|
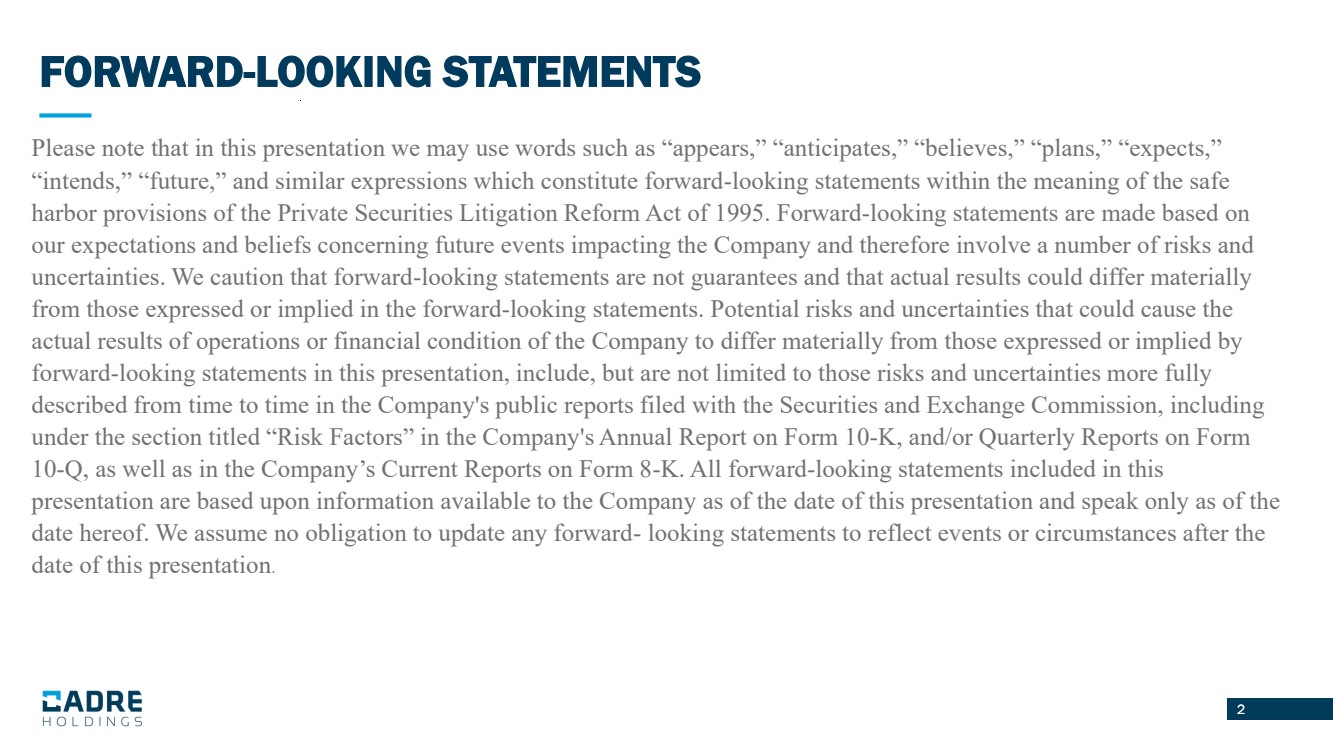
2 FORWARD-LOOKING STATEMENTS Please note that in this presentation we may use words such as “appears,” “anticipates,” “believes,” “plans,” “expects,” “intends,” “future,” and similar expressions which constitute forward-looking statements within the meaning of the safe harbor provisions of the Private Securities Litigation Reform Act of 1995. Forward-looking statements are made based on our expectations and beliefs concerning future events impacting the Company and therefore involve a number of risks and uncertainties. We caution that forward-looking statements are not guarantees and that actual results could differ materially from those expressed or implied in the forward-looking statements. Potential risks and uncertainties that could cause the actual results of operations or financial condition of the Company to differ materially from those expressed or implied by forward-looking statements in this presentation, include, but are not limited to those risks and uncertainties more fully described from time to time in the Company's public reports filed with the Securities and Exchange Commission, including under the section titled “Risk Factors” in the Company's Annual Report on Form 10-K, and/or Quarterly Reports on Form 10-Q, as well as in the Company’s Current Reports on Form 8-K. All forward-looking statements included in this presentation are based upon information available to the Company as of the date of this presentation and speak only as of the date hereof. We assume no obligation to update any forward- looking statements to reflect events or circumstances after the date of this presentation. 2 |
|
TODAY’S PRESENTERS 4 BRAD WILLIAMS President BLAINE BROWERS Chief Financial Officer WARREN KANDERS Chief Executive Officer and Chairman of the Board |

|
4 AGENDA • Q4 and FY Highlights • Business Overview • Financial Summary • Full Year Outlook • Conclusion and Q&A |

|
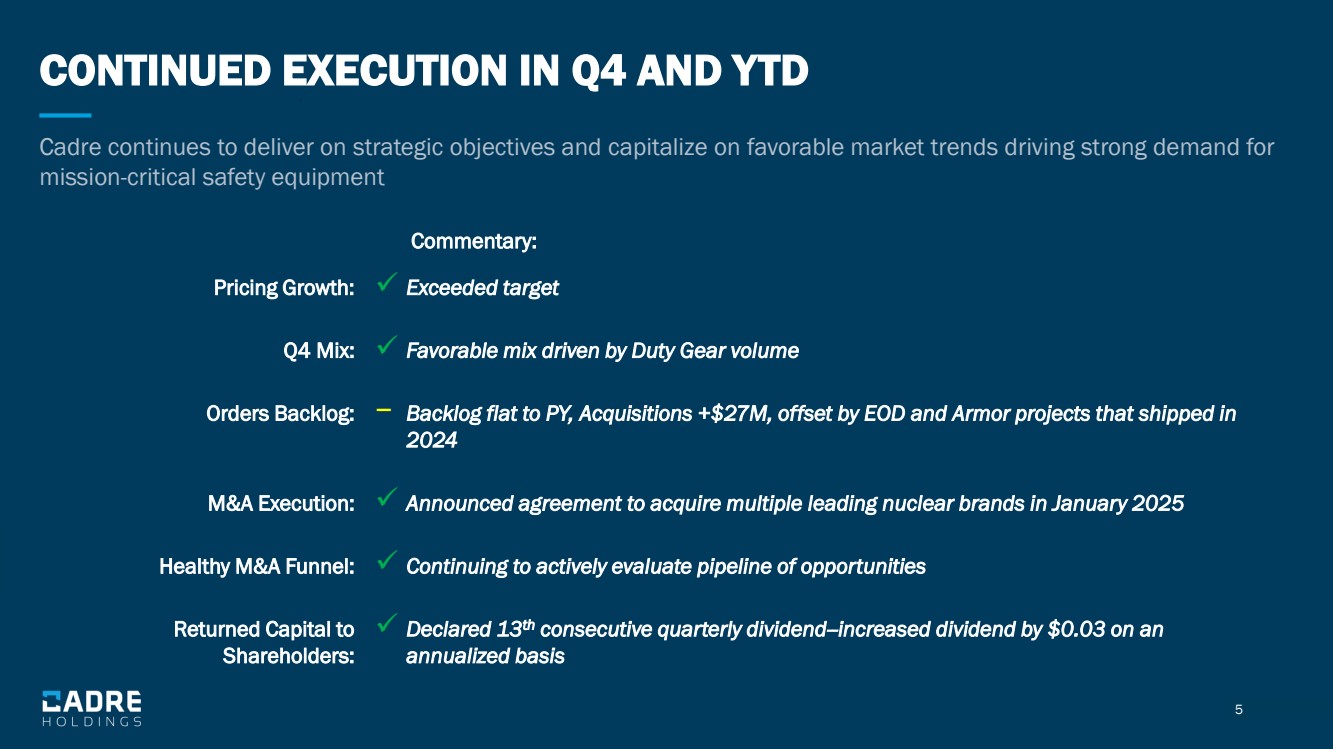
5 CONTINUED EXECUTION IN Q4 AND YTD Cadre continues to deliver on strategic objectives and capitalize on favorable market trends driving strong demand for mission-critical safety equipment Pricing Growth: ✓ Exceeded target Q4 Mix: ✓ Favorable mix driven by Duty Gear volume Orders Backlog: − Backlog flat to PY, Acquisitions +$27M, offset by EOD and Armor projects that shipped in 2024 M&A Execution: ✓ Announced agreement to acquire multiple leading nuclear brands in January 2025 Healthy M&A Funnel: ✓ Continuing to actively evaluate pipeline of opportunities Returned Capital to Shareholders: ✓ Declared 13th consecutive quarterly dividend--increased dividend by $0.03 on an annualized basis Commentary: |
|
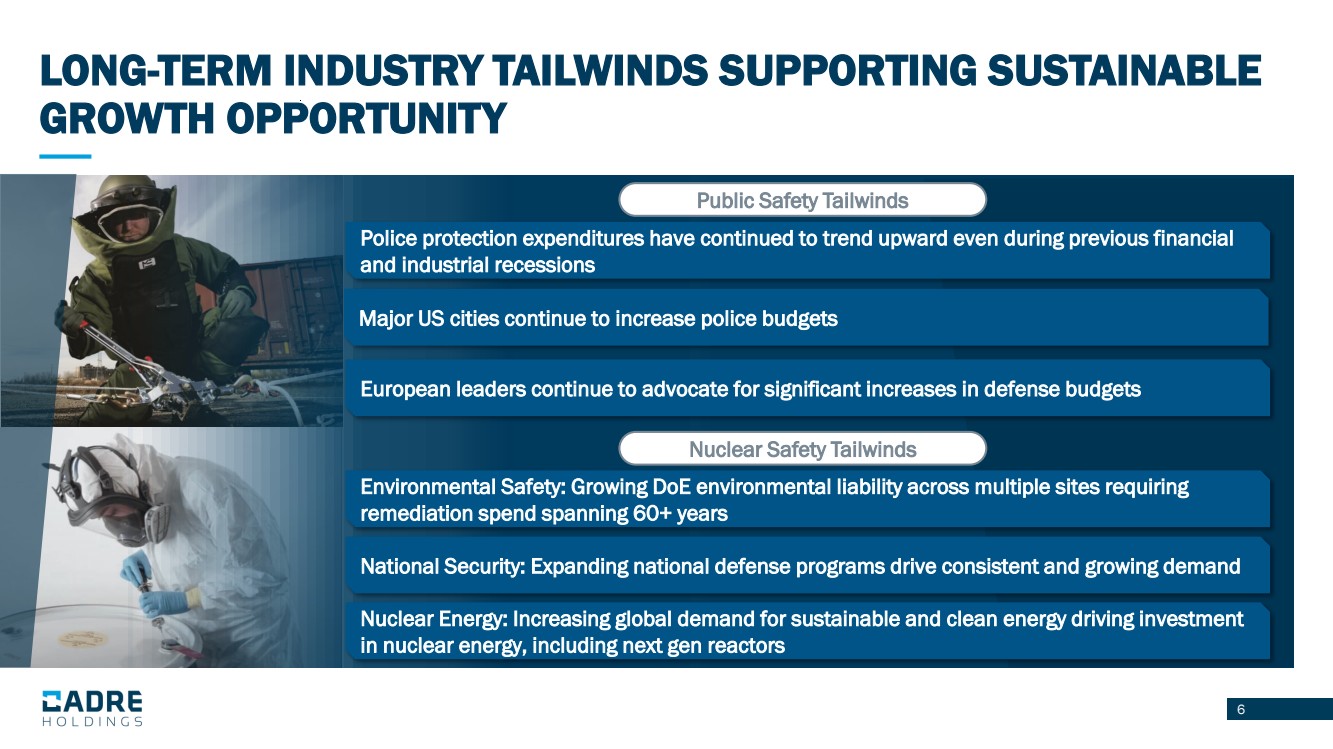
6 LONG-TERM INDUSTRY TAILWINDS SUPPORTING SUSTAINABLE GROWTH OPPORTUNITY Public Safety Tailwinds Nuclear Safety Tailwinds Environmental Safety: Growing DoE environmental liability across multiple sites requiring remediation spend spanning 60+ years National Security: Expanding national defense programs drive consistent and growing demand Nuclear Energy: Increasing global demand for sustainable and clean energy driving investment in nuclear energy, including next gen reactors European leaders continue to advocate for significant increases in defense budgets Police protection expenditures have continued to trend upward even during previous financial and industrial recessions Major US cities continue to increase police budgets |
|
7 • New administration has shown a continued commitment to prioritizing public safety • Focused on planning contingencies in a rapidly changing environment • Second consecutive year of high-single digit growth in Consumer duty gear channel • At SHOT Show in January, launched new upgraded armor package, as well as Ballast holster, the most advanced duty rated holster in the market North American Law Enforcement Geopolitical Landscape Consumer New Products/ Innovation LATEST MARKET TRENDS |

|
8 KEY M&A CRITERIA Business Financial Market Leading market position Cost structure where material > labor High cost of substitution Leading and defensible technology Mission -critical to customer Strong brand recognition Recurring revenue profile Asset -light Attractive ROIC Niche market No large -cap competition Resiliency through market cycles |

|
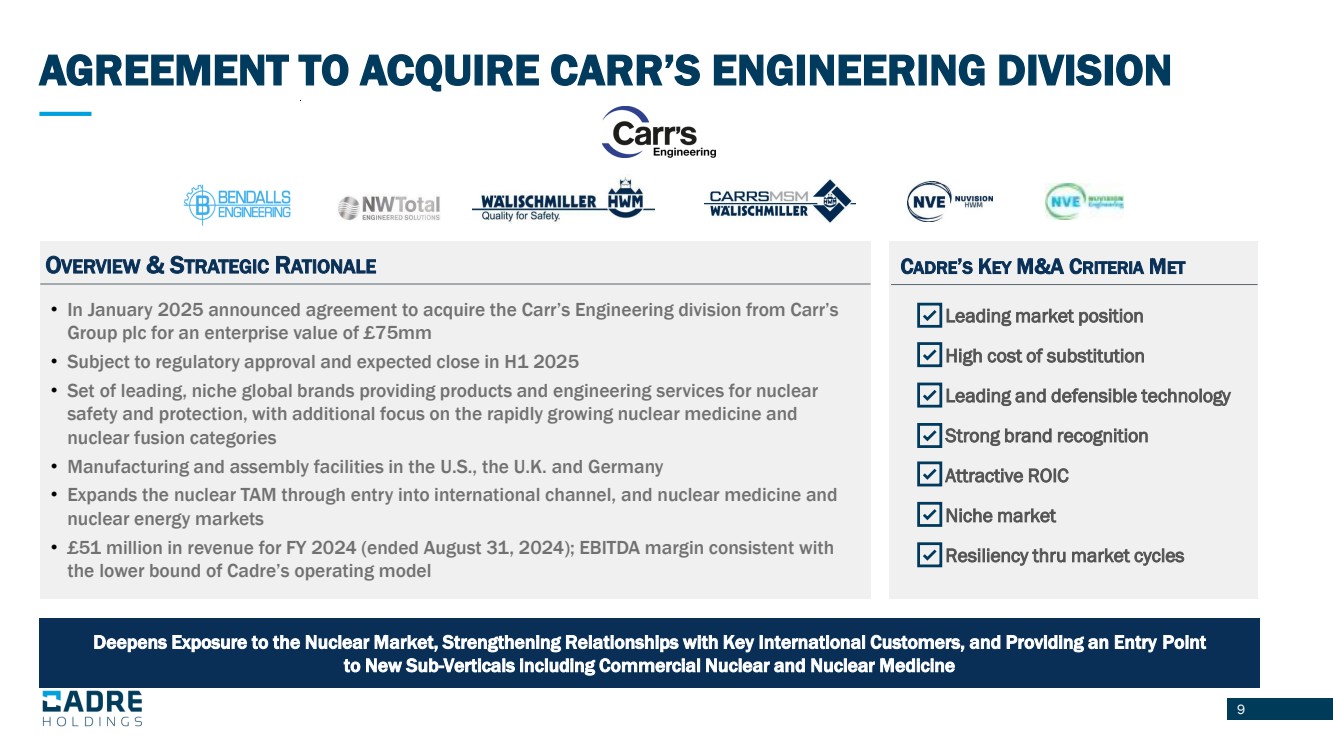
9 Source: Internal Company forecasts AGREEMENT TO ACQUIRE CARR’S ENGINEERING DIVISION Deepens Exposure to the Nuclear Market, Strengthening Relationships with Key International Customers, and Providing an Entry Point to New Sub-Verticals including Commercial Nuclear and Nuclear Medicine OVERVIEW & STRATEGIC RATIONALE • Leading market position • High cost of substitution • Leading and defensible technology • Strong brand recognition • Attractive ROIC • Niche market • Resiliency thru market cycles CADRE’S KEY M&A CRITERIA MET • In January 2025 announced agreement to acquire the Carr’s Engineering division from Carr’s Group plc for an enterprise value of £75mm • Subject to regulatory approval and expected close in H1 2025 • Set of leading, niche global brands providing products and engineering services for nuclear safety and protection, with additional focus on the rapidly growing nuclear medicine and nuclear fusion categories • Manufacturing and assembly facilities in the U.S., the U.K. and Germany • Expands the nuclear TAM through entry into international channel, and nuclear medicine and nuclear energy markets • £51 million in revenue for FY 2024 (ended August 31, 2024); EBITDA margin consistent with the lower bound of Cadre’s operating model |
|
10 Q4 Financial Results |

|
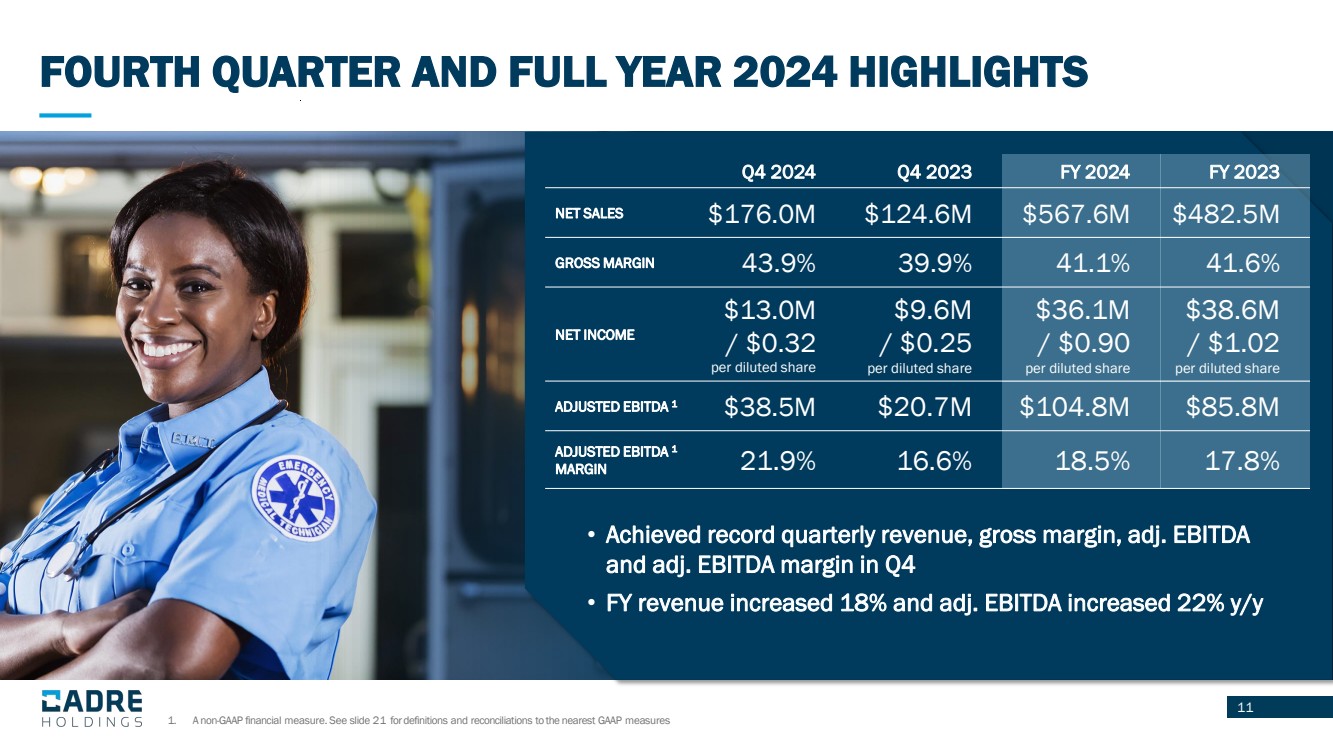
11 1. A non-GAAP financial measure. See slide 21 for definitions and reconciliations to the nearest GAAP measures FOURTH QUARTER AND FULL YEAR 2024 HIGHLIGHTS Q4 2024 Q4 2023 FY 2024 FY 2023 NET SALES $176.0M $124.6M $567.6M $482.5M GROSS MARGIN 43.9% 39.9% 41.1% 41.6% NET INCOME $13.0M / $0.32 per diluted share $9.6M / $0.25 per diluted share $36.1M / $0.90 per diluted share $38.6M / $1.02 per diluted share ADJUSTED EBITDA 1 $38.5M $20.7M $104.8M $85.8M ADJUSTED EBITDA 1 MARGIN 21.9% 16.6% 18.5% 17.8% • Achieved record quarterly revenue, gross margin, adj. EBITDA and adj. EBITDA margin in Q4 • FY revenue increased 18% and adj. EBITDA increased 22% y/y |
|
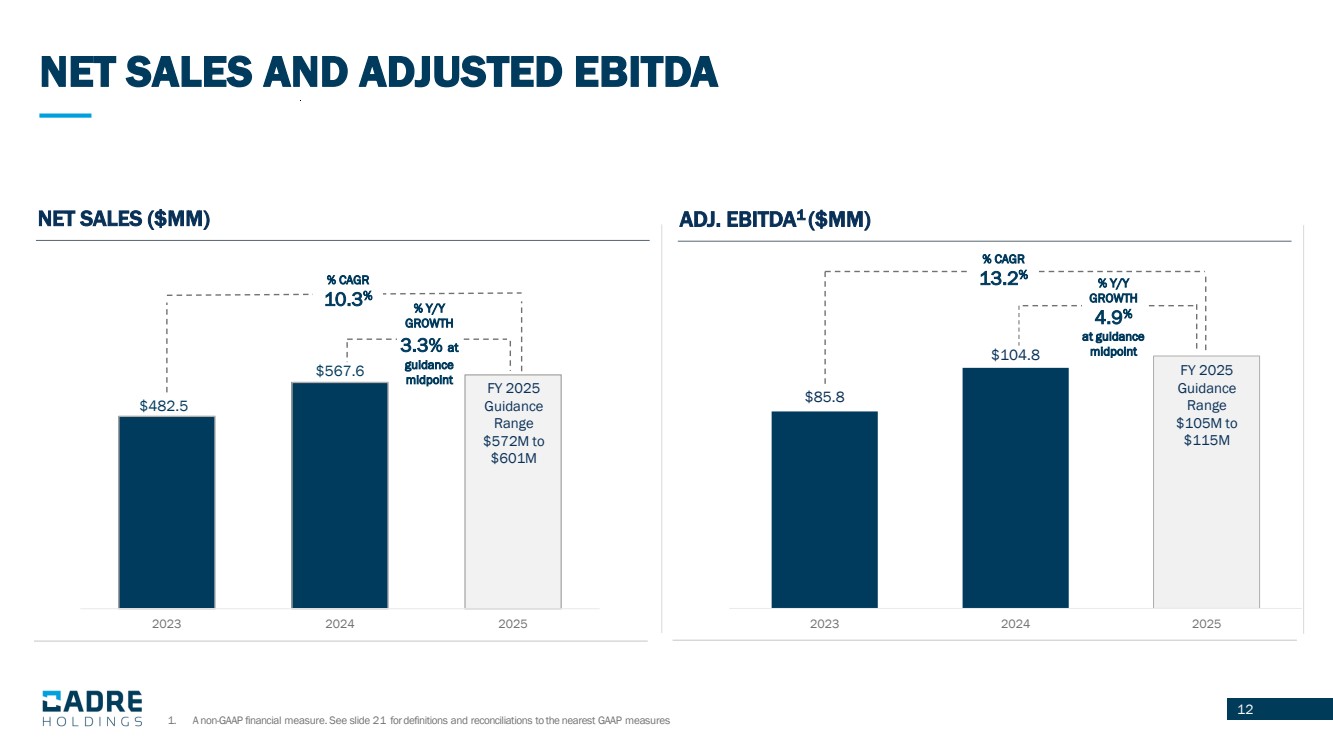
12 NET SALES AND ADJUSTED EBITDA NET SALES ($MM) $482.5 $567.6 2023 2024 2025 ADJ. EBITDA1 ($MM) $85.8 $104.8 2023 2024 2025 FY 2025 Guidance Range $572M to $601M FY 2025 Guidance Range $105M to $115M % CAGR 10.3% % Y/Y GROWTH 3.3% at guidance midpoint % CAGR 13.2% % Y/Y GROWTH 4.9% at guidance midpoint 1. A non-GAAP financial measure. See slide 21 for definitions and reconciliations to the nearest GAAP measures |
|
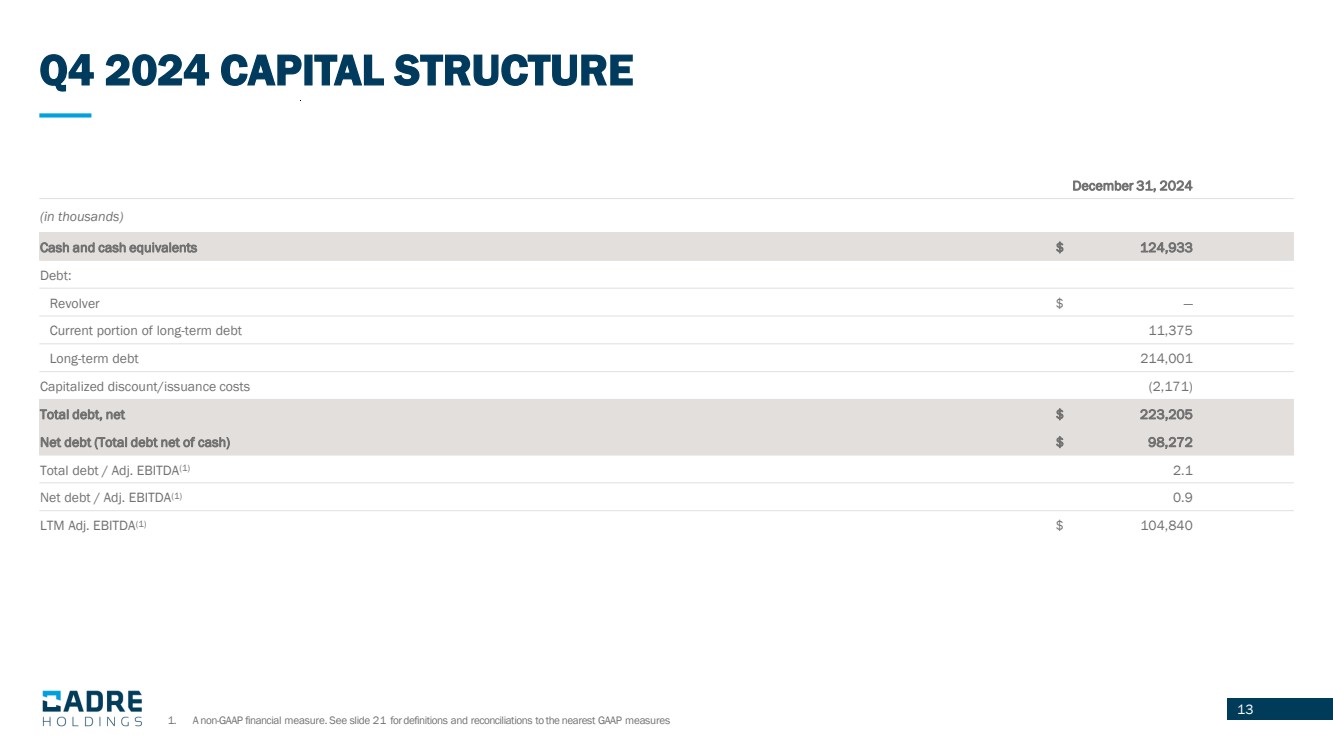
13 Q4 2024 CAPITAL STRUCTURE December 31, 2024 (in thousands) Cash and cash equivalents $ 124,933 Debt: Revolver $ — Current portion of long-term debt 11,375 Long-term debt 214,001 Capitalized discount/issuance costs (2,171) Total debt, net $ 223,205 Net debt (Total debt net of cash) $ 98,272 Total debt / Adj. EBITDA(1) 2.1 Net debt / Adj. EBITDA(1) 0.9 LTM Adj. EBITDA(1) $ 104,840 1. A non-GAAP financial measure. See slide 21 for definitions and reconciliations to the nearest GAAP measures |
|
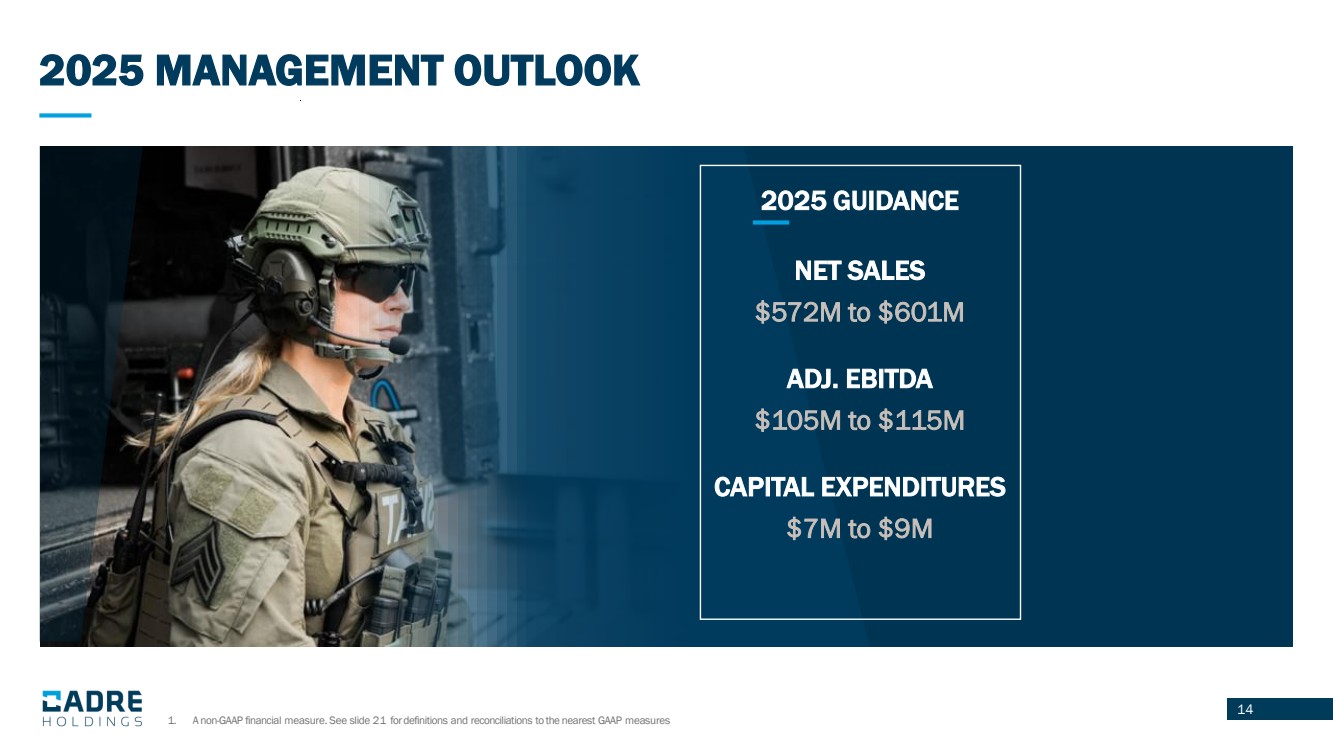
14 2025 MANAGEMENT OUTLOOK 2025 GUIDANCE NET SALES $572M to $601M ADJ. EBITDA $105M to $115M CAPITAL EXPENDITURES $7M to $9M 1. A non-GAAP financial measure. See slide 21 for definitions and reconciliations to the nearest GAAP measures |
|
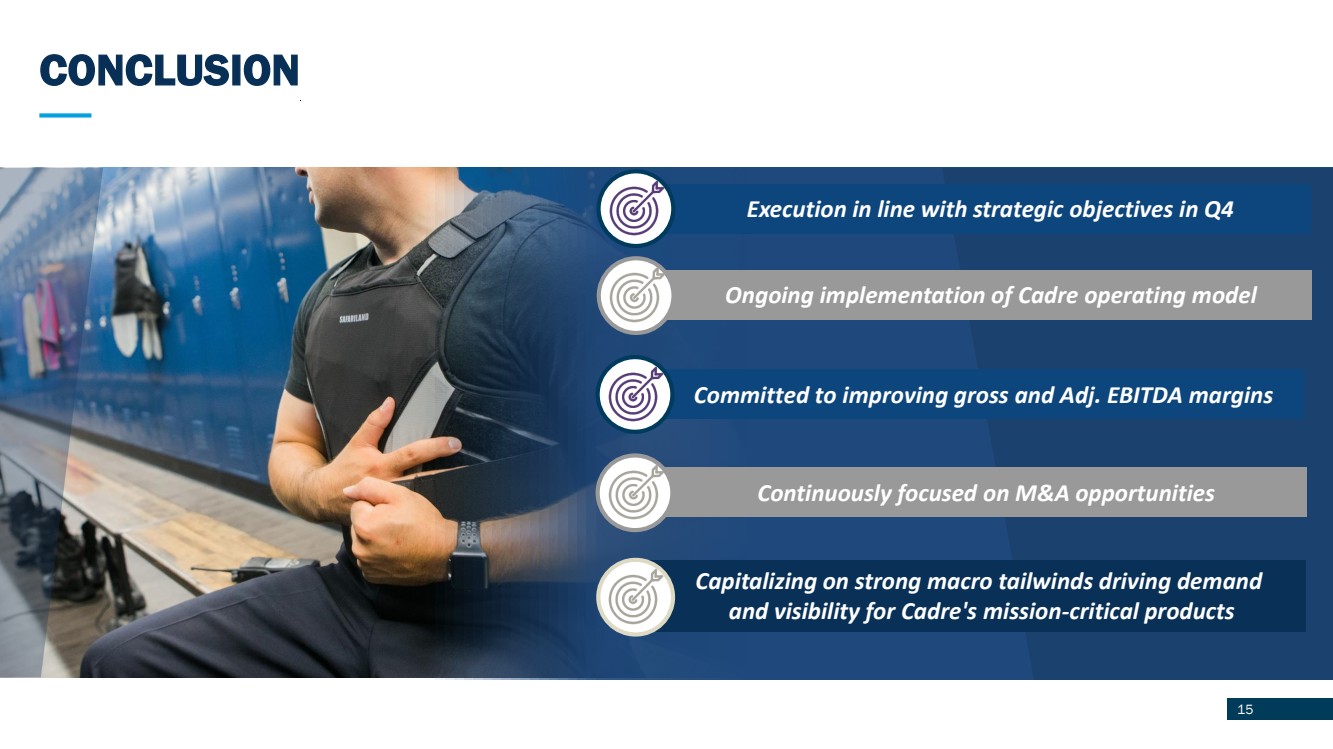
CONCLUSION 15 Execution in line with strategic objectives in Q4 Ongoing implementation of Cadre operating model Committed to improving gross and Adj. EBITDA margins Capitalizing on strong macro tailwinds driving demand and visibility for Cadre's mission-critical products Continuously focused on M&A opportunities |
|
16 APPENDIX |

|
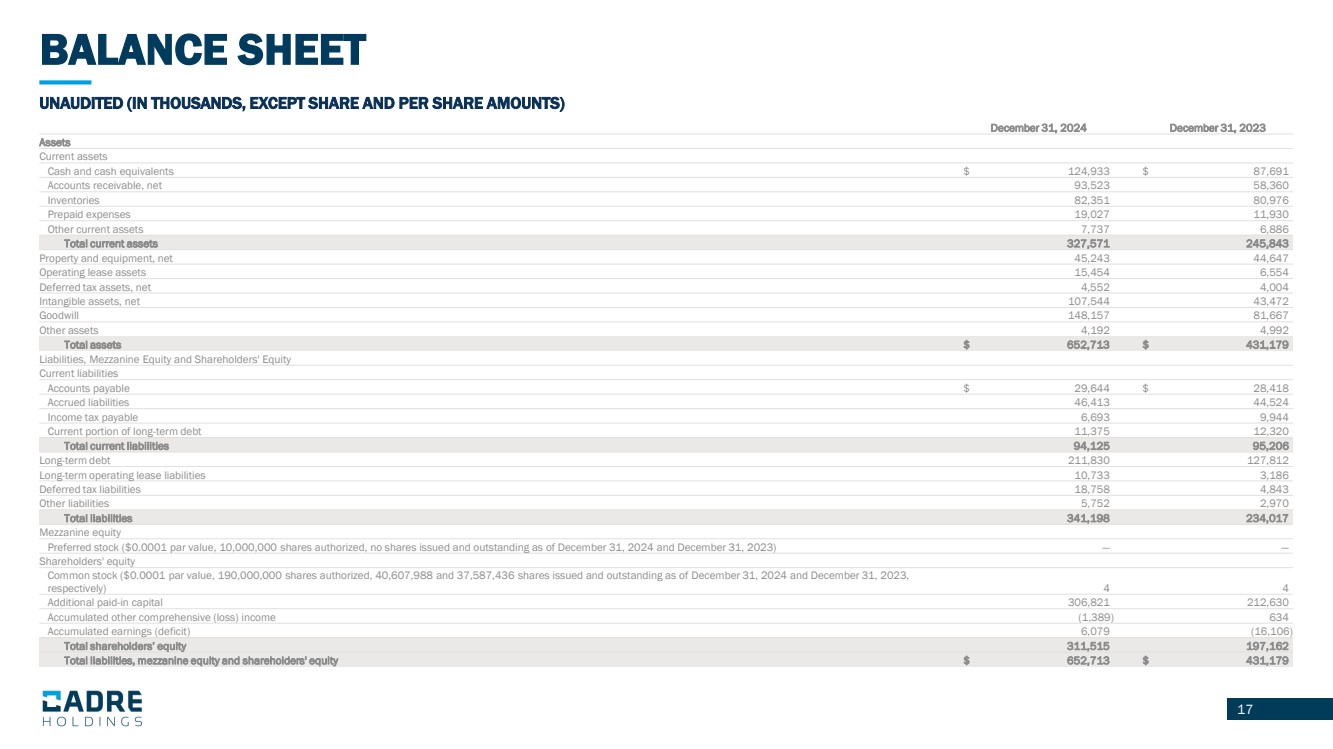
17 BALANCE SHEET UNAUDITED (IN THOUSANDS, EXCEPT SHARE AND PER SHARE AMOUNTS) December 31, 2024 December 31, 2023 Assets Current assets Cash and cash equivalents $ 124,933 $ 87,691 Accounts receivable, net 93,523 58,360 Inventories 82,351 80,976 Prepaid expenses 19,027 11,930 Other current assets 7,737 6,886 Total current assets 327,571 245,843 Property and equipment, net 45,243 44,647 Operating lease assets 15,454 6,554 Deferred tax assets, net 4,552 4,004 Intangible assets, net 107,544 43,472 Goodwill 148,157 81,667 Other assets 4,192 4,992 Total assets $ 652,713 $ 431,179 Liabilities, Mezzanine Equity and Shareholders' Equity Current liabilities Accounts payable $ 29,644 $ 28,418 Accrued liabilities 46,413 44,524 Income tax payable 6,693 9,944 Current portion of long-term debt 11,375 12,320 Total current liabilities 94,125 95,206 Long-term debt 211,830 127,812 Long-term operating lease liabilities 10,733 3,186 Deferred tax liabilities 18,758 4,843 Other liabilities 5,752 2,970 Total liabilities 341,198 234,017 Mezzanine equity Preferred stock ($0.0001 par value, 10,000,000 shares authorized, no shares issued and outstanding as of December 31, 2024 and December 31, 2023) — — Shareholders' equity Common stock ($0.0001 par value, 190,000,000 shares authorized, 40,607,988 and 37,587,436 shares issued and outstanding as of December 31, 2024 and December 31, 2023, respectively) 4 4 Additional paid-in capital 306,821 212,630 Accumulated other comprehensive (loss) income (1,389) 634 Accumulated earnings (deficit) 6,079 (16,106) Total shareholders’ equity 311,515 197,162 Total liabilities, mezzanine equity and shareholders' equity $ 652,713 $ 431,179 |
|
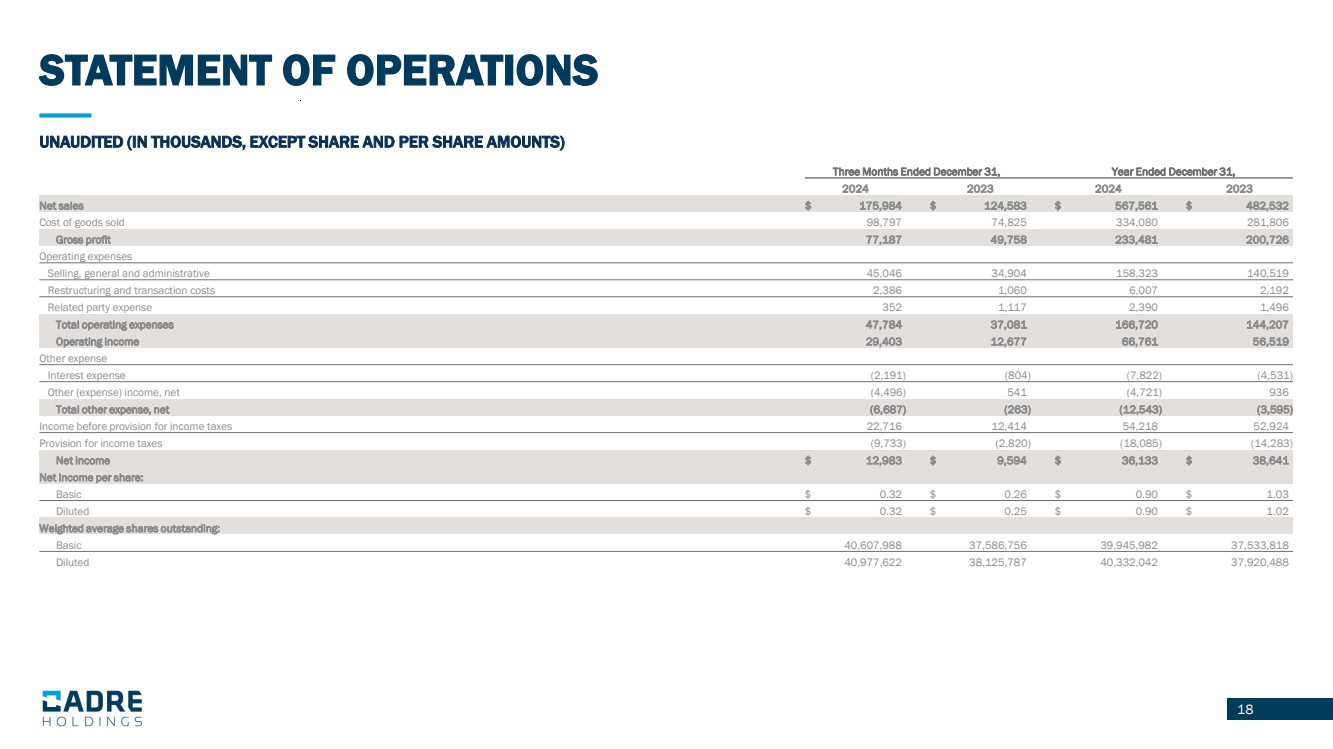
18 STATEMENT OF OPERATIONS UNAUDITED (IN THOUSANDS, EXCEPT SHARE AND PER SHARE AMOUNTS) Three Months Ended December 31, Year Ended December 31, 2024 2023 2024 2023 Net sales $ 175,984 $ 124,583 $ 567,561 $ 482,532 Cost of goods sold 98,797 74,825 334,080 281,806 Gross profit 77,187 49,758 233,481 200,726 Operating expenses Selling, general and administrative 45,046 34,904 158,323 140,519 Restructuring and transaction costs 2,386 1,060 6,007 2,192 Related party expense 352 1,117 2,390 1,496 Total operating expenses 47,784 37,081 166,720 144,207 Operating income 29,403 12,677 66,761 56,519 Other expense Interest expense (2,191) (804) (7,822) (4,531) Other (expense) income, net (4,496) 541 (4,721) 936 Total other expense, net (6,687) (263) (12,543) (3,595) Income before provision for income taxes 22,716 12,414 54,218 52,924 Provision for income taxes (9,733) (2,820) (18,085) (14,283) Net income $ 12,983 $ 9,594 $ 36,133 $ 38,641 Net income per share: Basic $ 0.32 $ 0.26 $ 0.90 $ 1.03 Diluted $ 0.32 $ 0.25 $ 0.90 $ 1.02 Weighted average shares outstanding: Basic 40,607,988 37,586,756 39,945,982 37,533,818 Diluted 40,977,622 38,125,787 40,332,042 37,920,488 |
|
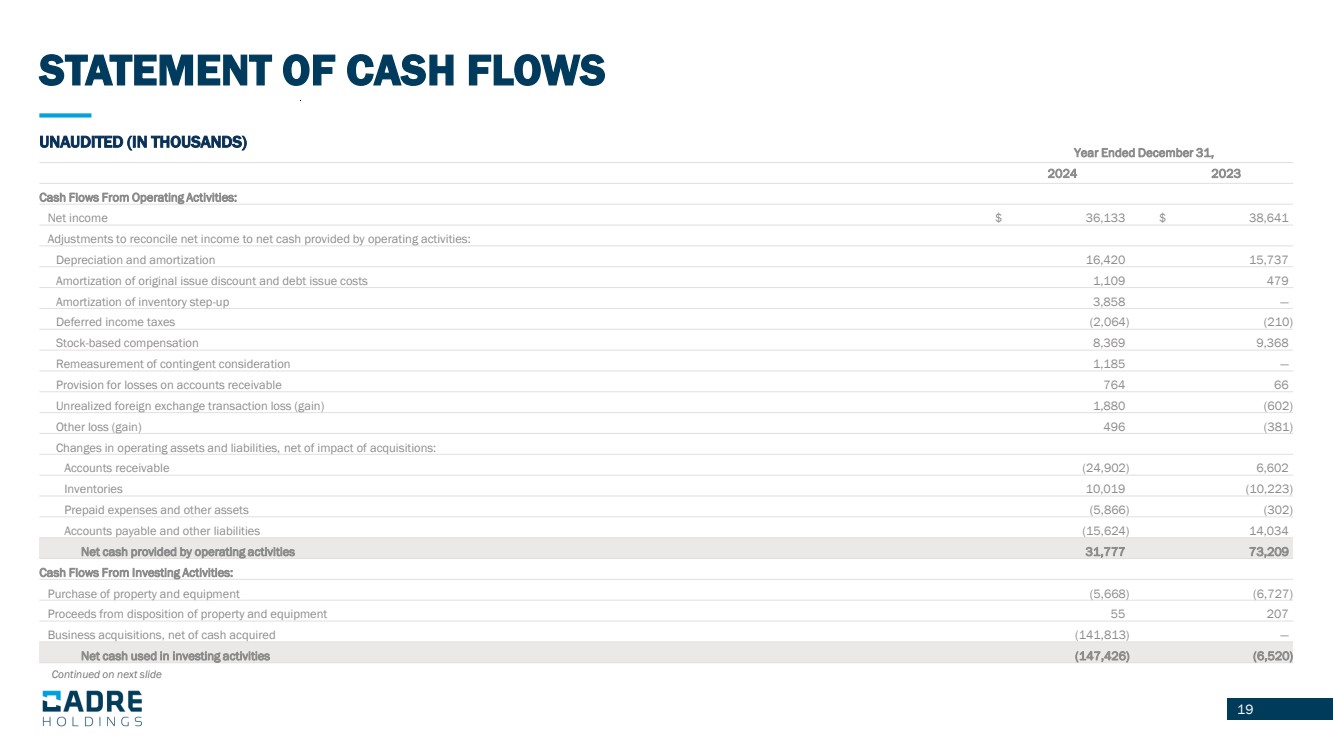
19 STATEMENT OF CASH FLOWS UNAUDITED (IN THOUSANDS) Year Ended December 31, 2024 2023 Cash Flows From Operating Activities: Net income $ 36,133 $ 38,641 Adjustments to reconcile net income to net cash provided by operating activities: Depreciation and amortization 16,420 15,737 Amortization of original issue discount and debt issue costs 1,109 479 Amortization of inventory step-up 3,858 — Deferred income taxes (2,064) (210) Stock-based compensation 8,369 9,368 Remeasurement of contingent consideration 1,185 — Provision for losses on accounts receivable 764 66 Unrealized foreign exchange transaction loss (gain) 1,880 (602) Other loss (gain) 496 (381) Changes in operating assets and liabilities, net of impact of acquisitions: Accounts receivable (24,902) 6,602 Inventories 10,019 (10,223) Prepaid expenses and other assets (5,866) (302) Accounts payable and other liabilities (15,624) 14,034 Net cash provided by operating activities 31,777 73,209 Cash Flows From Investing Activities: Purchase of property and equipment (5,668) (6,727) Proceeds from disposition of property and equipment 55 207 Business acquisitions, net of cash acquired (141,813) — Net cash used in investing activities (147,426) (6,520) Continued on next slide |
|
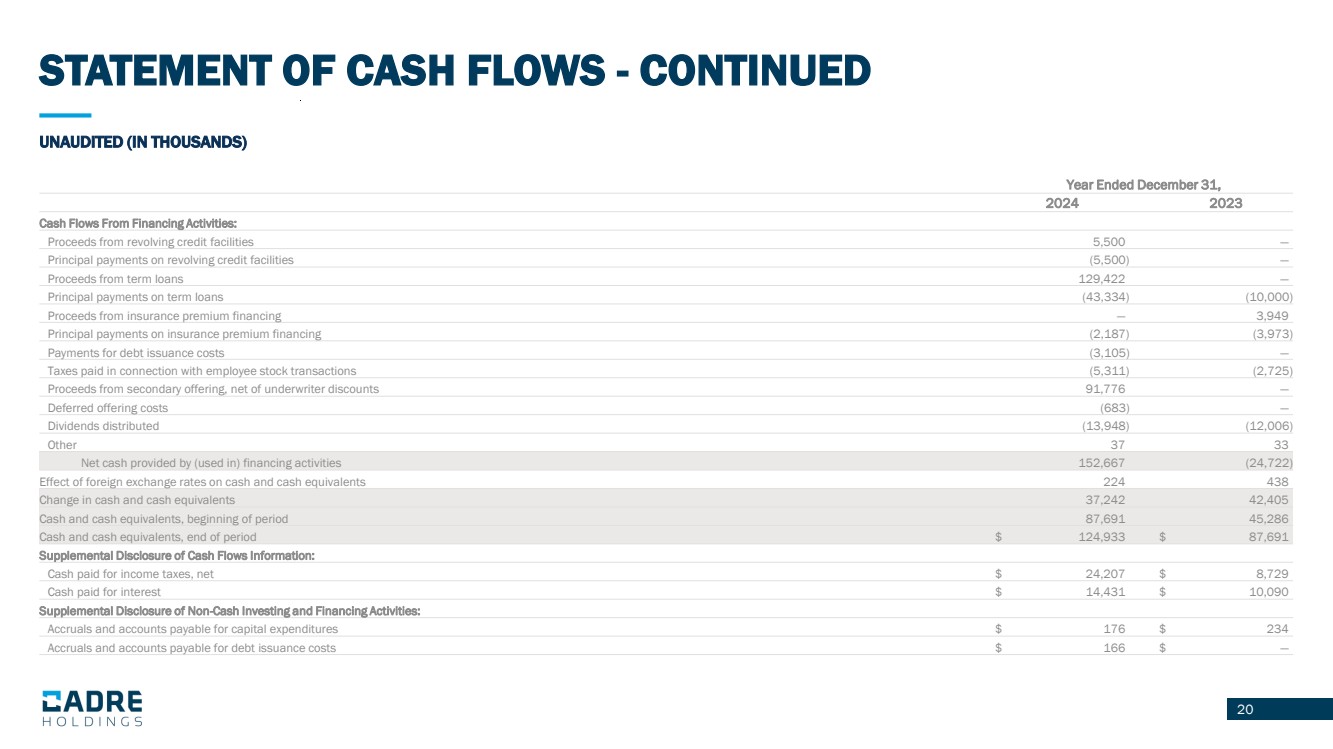
20 STATEMENT OF CASH FLOWS - CONTINUED UNAUDITED (IN THOUSANDS) Year Ended December 31, 2024 2023 Cash Flows From Financing Activities: Proceeds from revolving credit facilities 5,500 — Principal payments on revolving credit facilities (5,500) — Proceeds from term loans 129,422 — Principal payments on term loans (43,334) (10,000) Proceeds from insurance premium financing — 3,949 Principal payments on insurance premium financing (2,187) (3,973) Payments for debt issuance costs (3,105) — Taxes paid in connection with employee stock transactions (5,311) (2,725) Proceeds from secondary offering, net of underwriter discounts 91,776 — Deferred offering costs (683) — Dividends distributed (13,948) (12,006) Other 37 33 Net cash provided by (used in) financing activities 152,667 (24,722) Effect of foreign exchange rates on cash and cash equivalents 224 438 Change in cash and cash equivalents 37,242 42,405 Cash and cash equivalents, beginning of period 87,691 45,286 Cash and cash equivalents, end of period $ 124,933 $ 87,691 Supplemental Disclosure of Cash Flows Information: Cash paid for income taxes, net $ 24,207 $ 8,729 Cash paid for interest $ 14,431 $ 10,090 Supplemental Disclosure of Non-Cash Investing and Financing Activities: Accruals and accounts payable for capital expenditures $ 176 $ 234 Accruals and accounts payable for debt issuance costs $ 166 $ — |
|
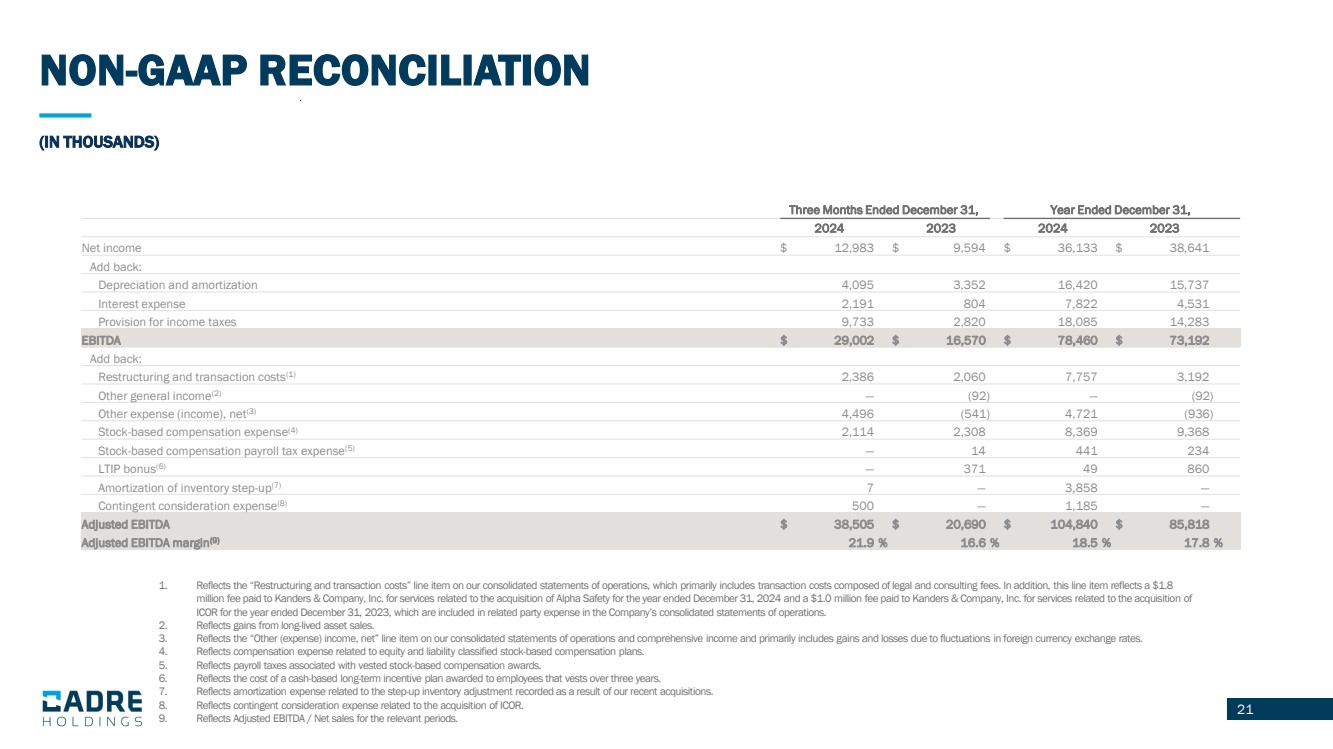
21 1. Reflects the “Restructuring and transaction costs” line item on our consolidated statements of operations, which primarily includes transaction costs composed of legal and consulting fees. In addition, this line item reflects a $1.8 million fee paid to Kanders & Company, Inc. for services related to the acquisition of Alpha Safety for the year ended December 31, 2024 and a $1.0 million fee paid to Kanders & Company, Inc. for services related to the acquisition of ICOR for the year ended December 31, 2023, which are included in related party expense in the Company’s consolidated statements of operations. 2. Reflects gains from long-lived asset sales. 3. Reflects the “Other (expense) income, net” line item on our consolidated statements of operations and comprehensive income and primarily includes gains and losses due to fluctuations in foreign currency exchange rates. 4. Reflects compensation expense related to equity and liability classified stock-based compensation plans. 5. Reflects payroll taxes associated with vested stock-based compensation awards. 6. Reflects the cost of a cash-based long-term incentive plan awarded to employees that vests over three years. 7. Reflects amortization expense related to the step-up inventory adjustment recorded as a result of our recent acquisitions. 8. Reflects contingent consideration expense related to the acquisition of ICOR. 9. Reflects Adjusted EBITDA / Net sales for the relevant periods. 21 (IN THOUSANDS) NON-GAAP RECONCILIATION Three Months Ended December 31, Year Ended December 31, 2024 2023 2024 2023 Net income $ 12,983 $ 9,594 $ 36,133 $ 38,641 Add back: Depreciation and amortization 4,095 3,352 16,420 15,737 Interest expense 2,191 804 7,822 4,531 Provision for income taxes 9,733 2,820 18,085 14,283 EBITDA $ 29,002 $ 16,570 $ 78,460 $ 73,192 Add back: Restructuring and transaction costs(1) 2,386 2,060 7,757 3,192 Other general income(2) — (92) — (92) Other expense (income), net(3) 4,496 (541) 4,721 (936) Stock-based compensation expense(4) 2,114 2,308 8,369 9,368 Stock-based compensation payroll tax expense(5) — 14 441 234 LTIP bonus(6) — 371 49 860 Amortization of inventory step-up(7) 7 — 3,858 — Contingent consideration expense(8) 500 — 1,185 — Adjusted EBITDA $ 38,505 $ 20,690 $ 104,840 $ 85,818 Adjusted EBITDA margin(9) 21.9 % 16.6 % 18.5 % 17.8 % |
|
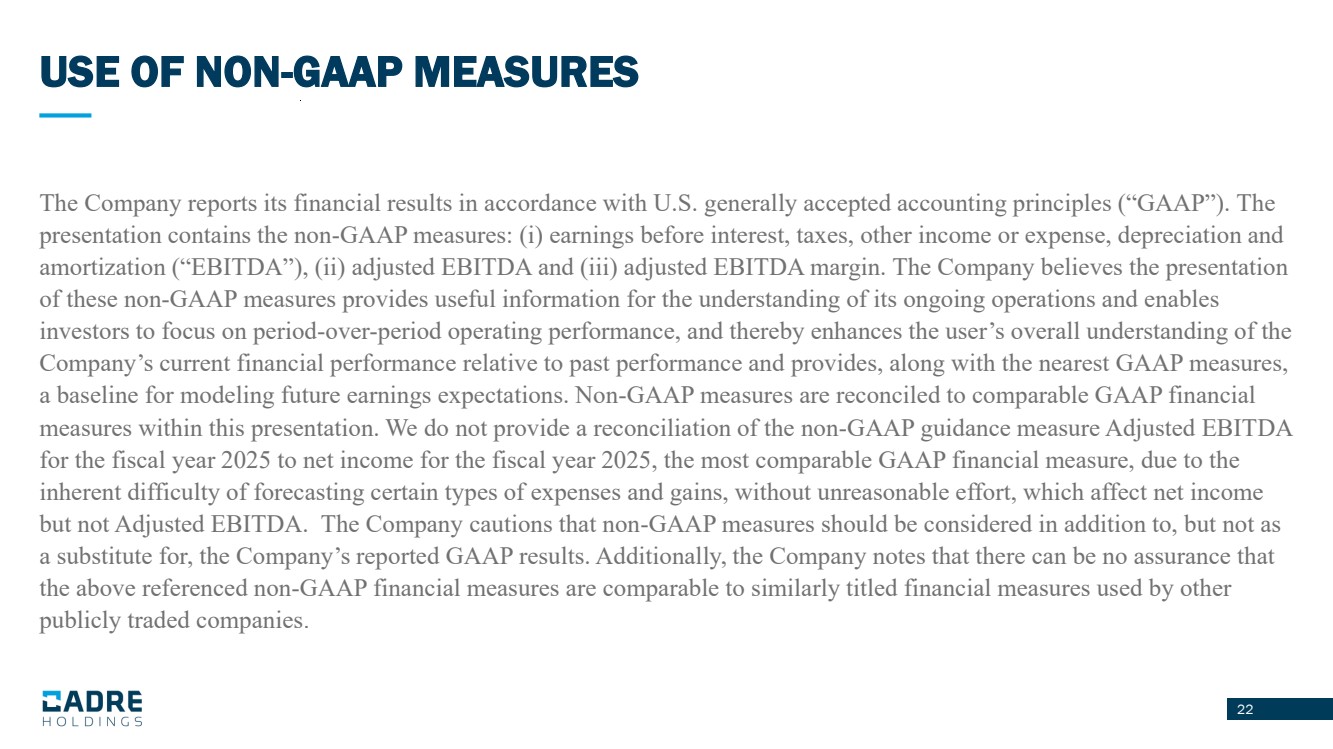
22 USE OF NON-GAAP MEASURES The Company reports its financial results in accordance with U.S. generally accepted accounting principles (“GAAP”). The presentation contains the non-GAAP measures: (i) earnings before interest, taxes, other income or expense, depreciation and amortization (“EBITDA”), (ii) adjusted EBITDA and (iii) adjusted EBITDA margin. The Company believes the presentation of these non-GAAP measures provides useful information for the understanding of its ongoing operations and enables investors to focus on period-over-period operating performance, and thereby enhances the user’s overall understanding of the Company’s current financial performance relative to past performance and provides, along with the nearest GAAP measures, a baseline for modeling future earnings expectations. Non-GAAP measures are reconciled to comparable GAAP financial measures within this presentation. We do not provide a reconciliation of the non-GAAP guidance measure Adjusted EBITDA for the fiscal year 2025 to net income for the fiscal year 2025, the most comparable GAAP financial measure, due to the inherent difficulty of forecasting certain types of expenses and gains, without unreasonable effort, which affect net income but not Adjusted EBITDA. The Company cautions that non-GAAP measures should be considered in addition to, but not as a substitute for, the Company’s reported GAAP results. Additionally, the Company notes that there can be no assurance that the above referenced non-GAAP financial measures are comparable to similarly titled financial measures used by other publicly traded companies. |